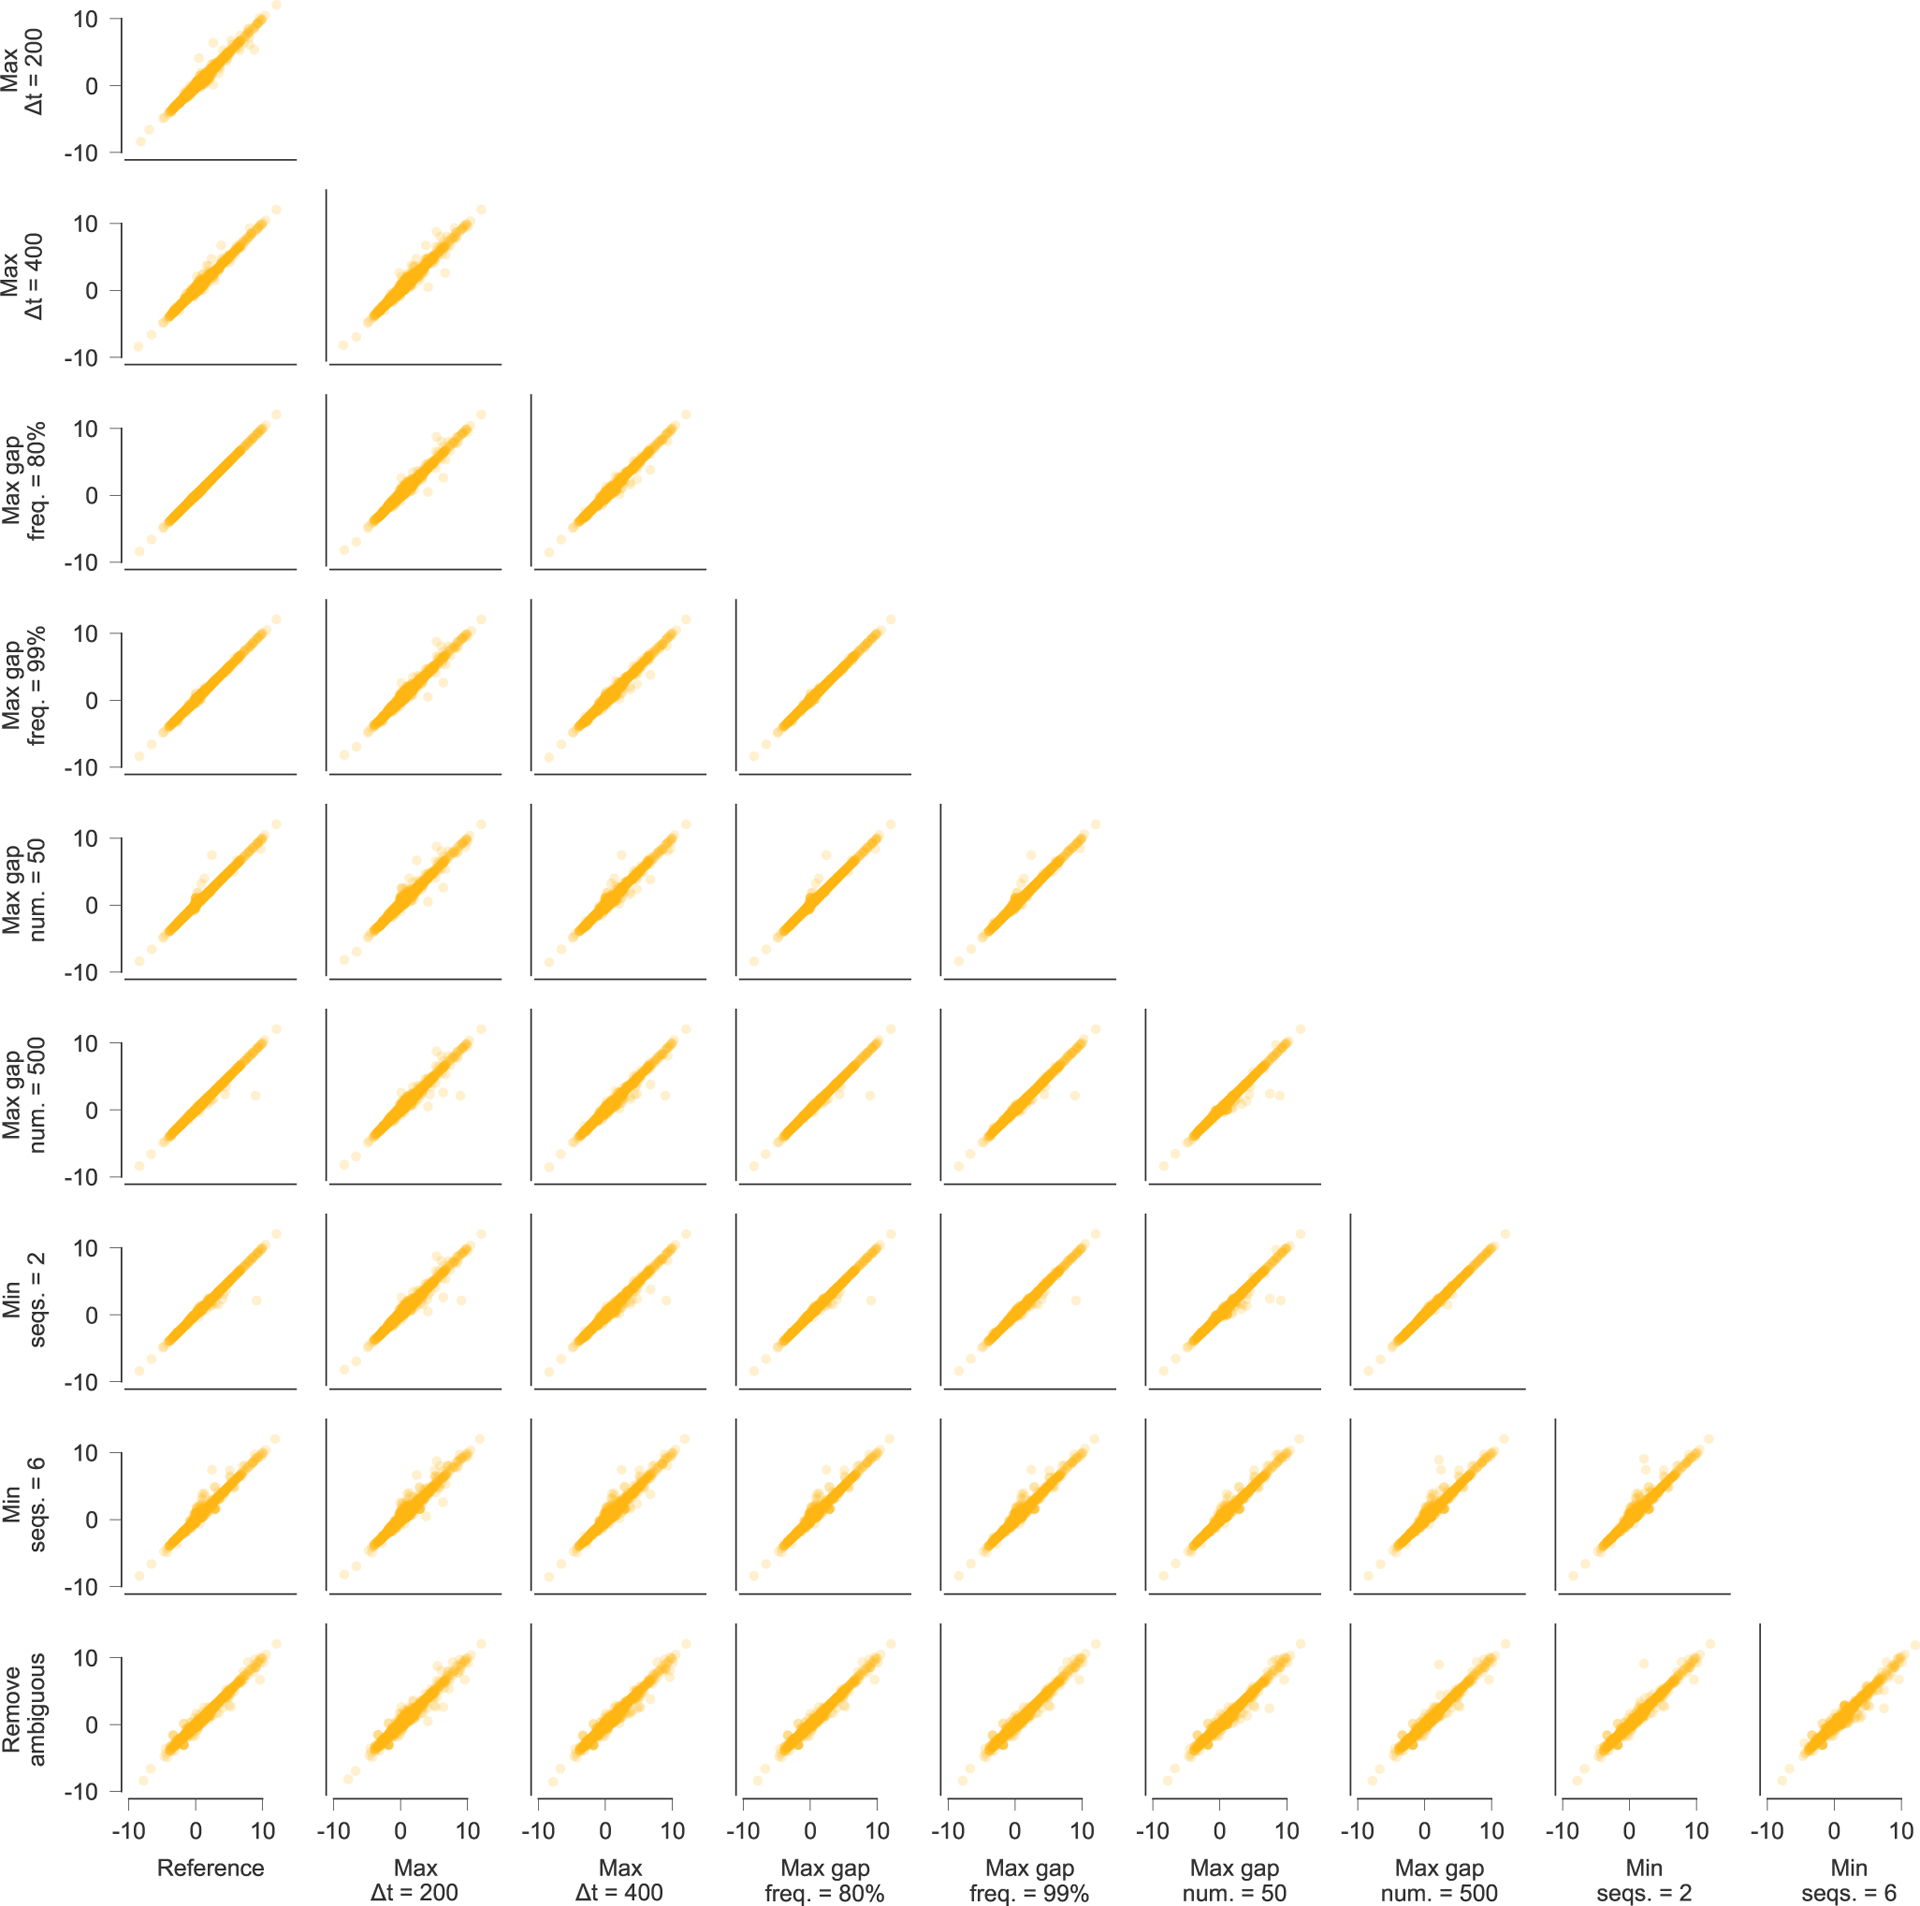
Extended Data Fig. 10 |. inferred selection coefficients across patients using different conventions for data processing.

Inferred selection coefficients are highly similar following different choices for processing the sequence data. Pearson R2 values between inferred selection coefficients range from 0.97 to 1.00, with an average of 0.99. Data processing conventions. Reference: current data processing conventions. Max Δt = 200/400: remove time points that are more than 200/400 days beyond the last included time point (reference: 300 days). Max gap freq. = 80%/99%: remove sites where >80%/99% of observed variants are gaps (reference: 95%). Max gap num. = 50/500: remove sequences with >50/500 gaps in excess of subtype consensus (reference: 200). Min seqs. = 2/6: remove time points with <2/6 available sequences (reference: 4). Remove ambiguous: remove sequences that contain ambiguous nucleotides if any other nucleotide variation is observed at the same site. LTR, long terminal repeat.
