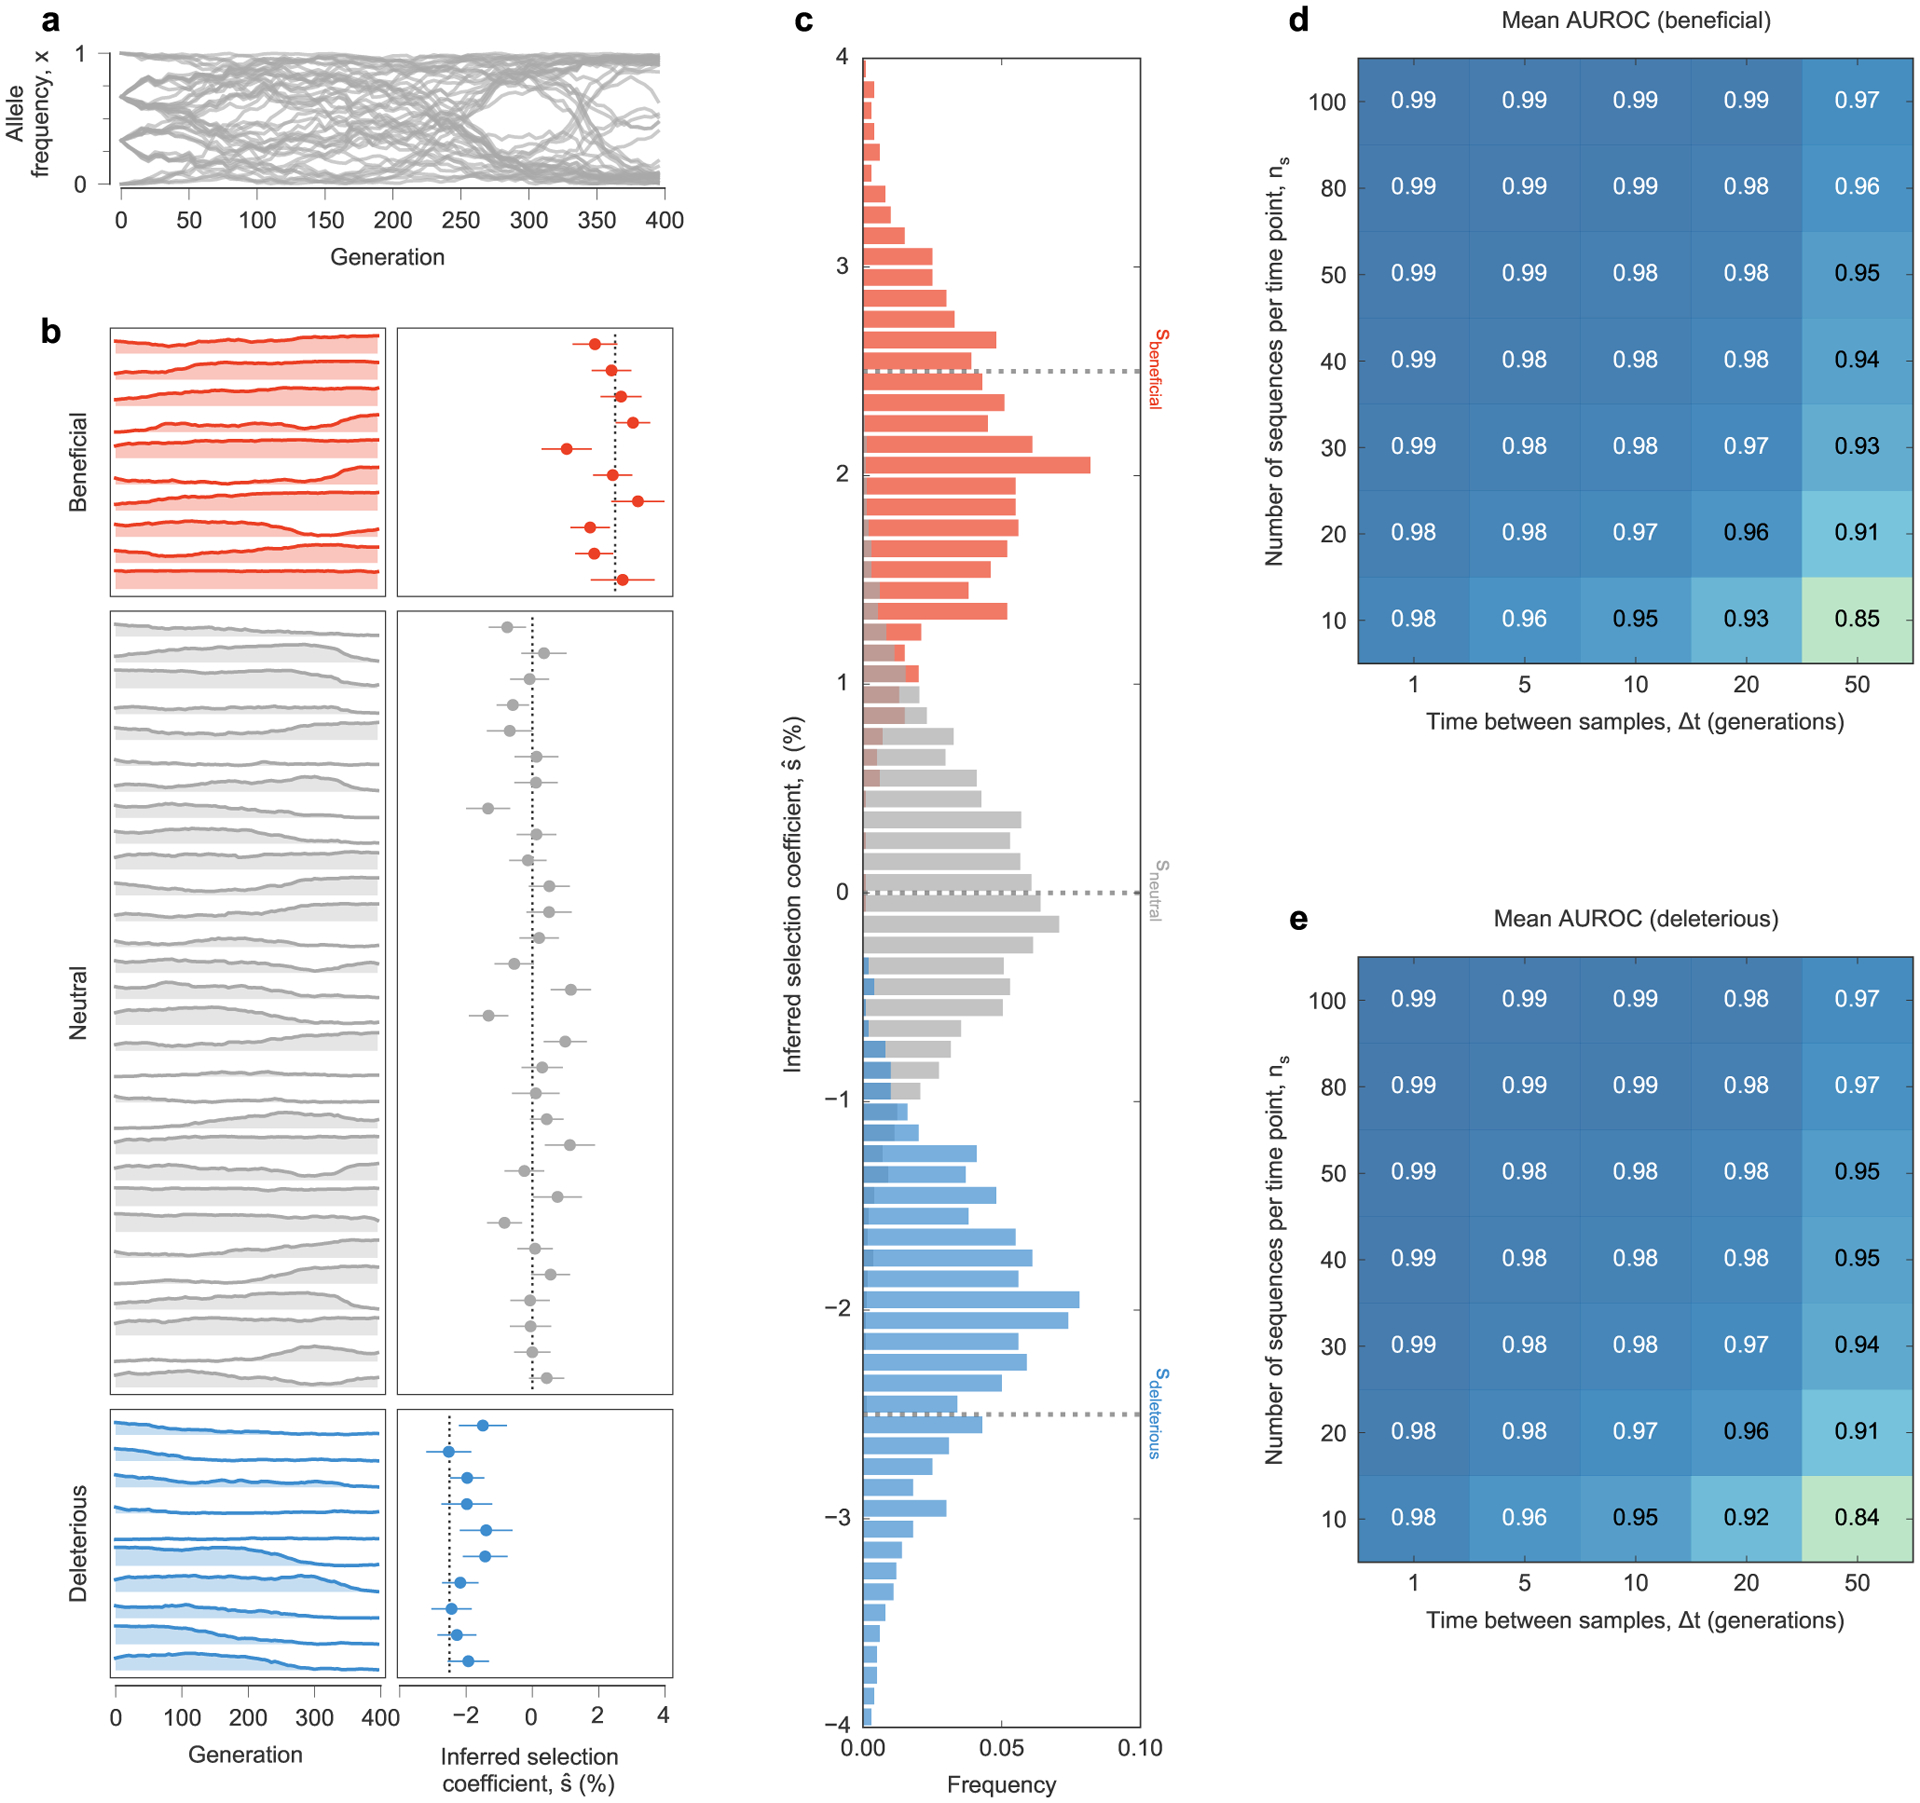
Extended Data Fig. 1 |. MPL accurately recovers selection coefficients from complex simulated evolutionary trajectories.

a, Trajectories of mutant allele frequencies over time exhibit complex dynamics in a WF simulation with a simple fitness landscape. b, Separate views of individual trajectories for beneficial, neutral, and deleterious mutants (left panel) and inferred selection coefficients (right panel) for a single simulation run. Note that many neutral mutations exhibit temporal variation similar to beneficial or deleterious mutations. MPL estimates the underlying selection coefficients used to generate these trajectories, presented as mean values ± one theoretical standard deviation, and distinguishes between beneficial, neutral, and deleterious mutations, using Eq. (11). Dashed lines mark the true selection coefficients. c, Distributions of selection coefficient estimates across n = 100 replicate simulations with identical parameters in the special case of perfect sampling. MPL is also robust to finite sampling constraints, accurately classifying beneficial (d) and deleterious (e) mutants even when the number of sequences sampled per time point ns is low, and the spacing between time samples Δt is large. Simulation parameters. L = 50 loci with two alleles at each locus (mutant and WT): ten beneficial mutants with s = 0.025, 30 neutral mutants with s = 0, and ten deleterious mutants with s = −0.025. Mutation probability μ = 10−3, population size N = 103. Initial population composed of approximately equal numbers of three random founder sequences, evolved over T = 400 generations.
