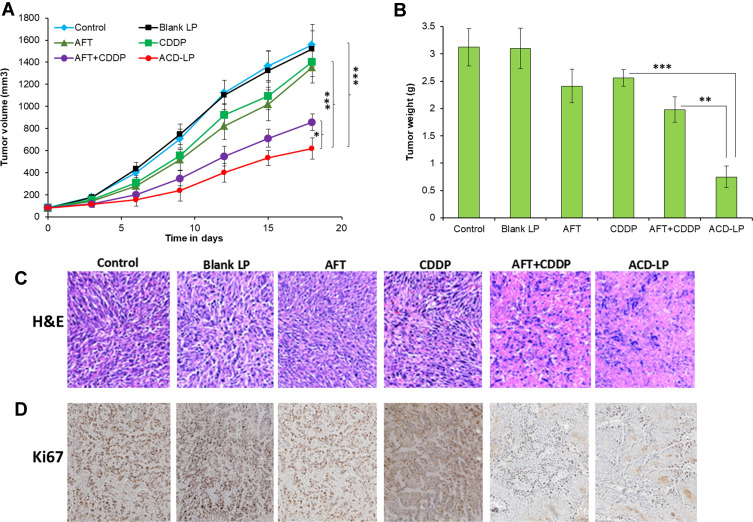
Figure 7.
(A) Inhibition of tumor growth by different formulations in a nasopharyngeal carcinoma-bearing xenograft model. The groups included an untreated control group and groups given empty nanoparticles, the free drugs (alone or in combination), and cisplatin- and afatinib-loaded lipid–polymer hybrid nanoparticles. All formulations were given intravenously every third day (three injections). The data are means ± standard deviation. (B) The tumor weights. The data are means ± standard deviations. *p<0.05, **p<0.01 and ***p<0.0001 is the statistical difference. (C and D) Histochemical analysis of tumor tissues treated with different formulations.

