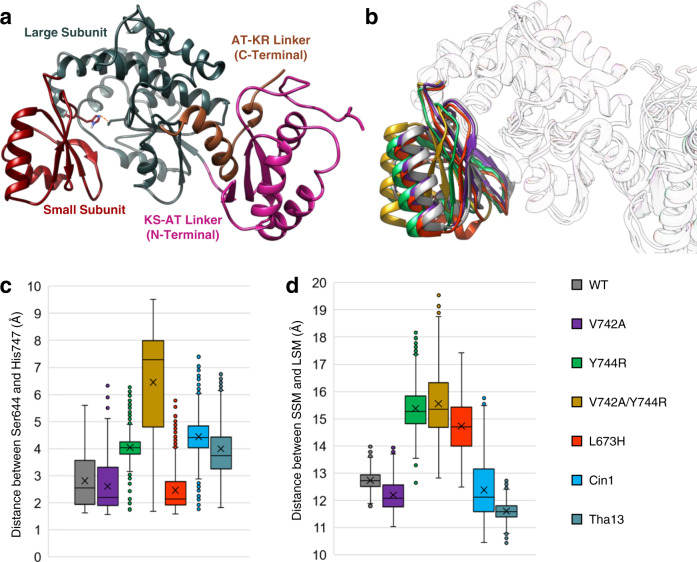
Fig. 2. Molecular dynamic simulations of wild-type and variant EryAT6.
a Final homology model of EryAT6 containing both linkers. The catalytic dyad is shown as sticks with the distance between indicated with a dashed orange line. b Overlay of time-averaged structures from the EryAT6 wild-type and mutant simulations highlighting the distortion of the small subunit. c A box plot shows how the distance between the catalytic dyad varied over simulation time for each EryAT6 variant. d A box plot shows how the distance between the center of mass for the SSM and LSM varied over simulation time for each EryAT6 variant. The X indicates the mean. The boxes represent the range from the first to third quartiles with the center line representing the median. The whiskers represent the minima and maxima or, in the presence of outliers indicated by points, 1.5 times the interquartile range. These distances were measured every 0.1 ns over the final 80 ns (n = 800) of two independent simulations. WT = wild-type. Source data are provided as a Source Data file.

