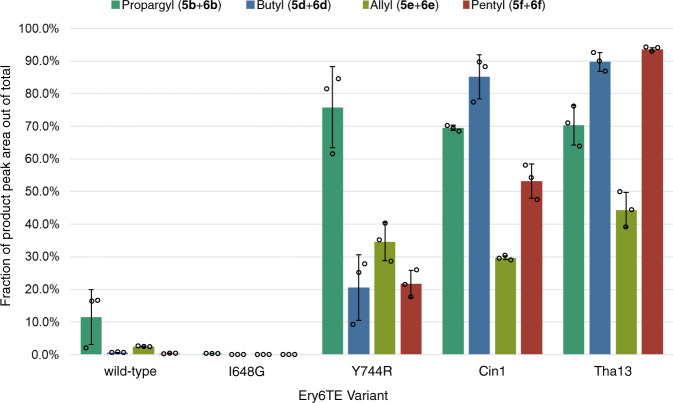
Fig. 7. Product distributions catalyzed by motif-swapped Ery6TE variants with two competing substrates.
Ery6TE extension unit competition assay with 1.5 mM 1 and 1.5 mM each of either 2b, 2d, 2e, or 2f. Average percentage of each indicated product out of the total products in each reaction as determined by HR-LC-MS analysis. Error bars are the standard deviation (n = 3 biological replicates) of the mean. Individual replicates are shown as circles. Source data are provided as a Source Data file.

