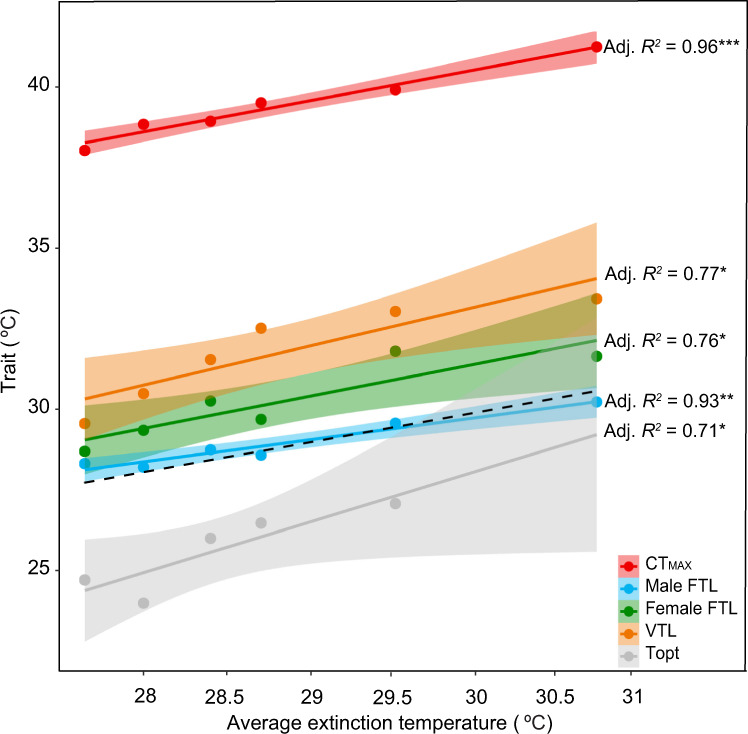
Fig. 2. Associations between different estimates of thermal tolerance and average extinction temperature across six Drosophila species.

Critical thermal maximum (knockdown CTmax, red), male upper fertility thermal limits (male FTL50, blue), female upper fertility thermal limits (female FTL50, green), upper egg-to-adult viability thermal limits (VTL80, orange) and optimum thermal temperature (Topt, grey) all show significant positive linear associations with average extinction temperature. Each point represents thermal tolerance for each species (see Supplementary Table S9 for values), the solid lines represent the fitted linear model and the shaded areas are the 95% confidence interval of this model. The dashed black line represents the direct relationship (slope = 1) between tolerance and average extinction temperature. Male FTLs are the only estimate of thermal tolerance that does not significantly differ from extinction temperature (two-sided paired t-test, t = 0.738, df = 5, P = 0.494).
