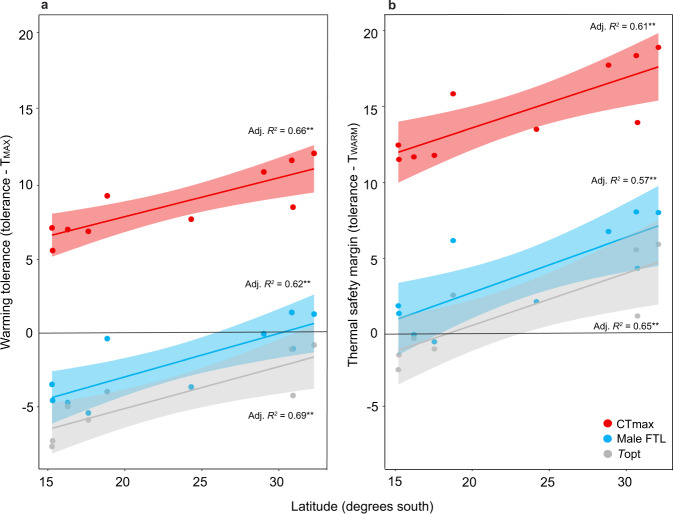
Fig. 3. Thermal safety margins and warming tolerances across latitude for ten Drosophila species using different estimates of thermal tolerance.
a Warming tolerance (tolerance minus maximum habitat temperature (TMAX)) and b thermal safety margins (tolerance minus average habitat temperature during summer months (TWARM) calculated using critical thermal maxima (knockdown CTmax, red), male upper fertility thermal limits (male FTL50, blue) and optimum thermal temperature (Topt, grey, note only eight species)) were lower in species from low latitudes. Warming tolerance (a) and thermal safety margins (b) using CTmax were higher than thermal safety margins using male FTLs (b). Each point represents warming tolerance/thermal safety margins for single species, the solid lines represent the fitted linear models and the shaded areas are the 95% confidence interval of these models. Source data are provided in the Source Data file.

