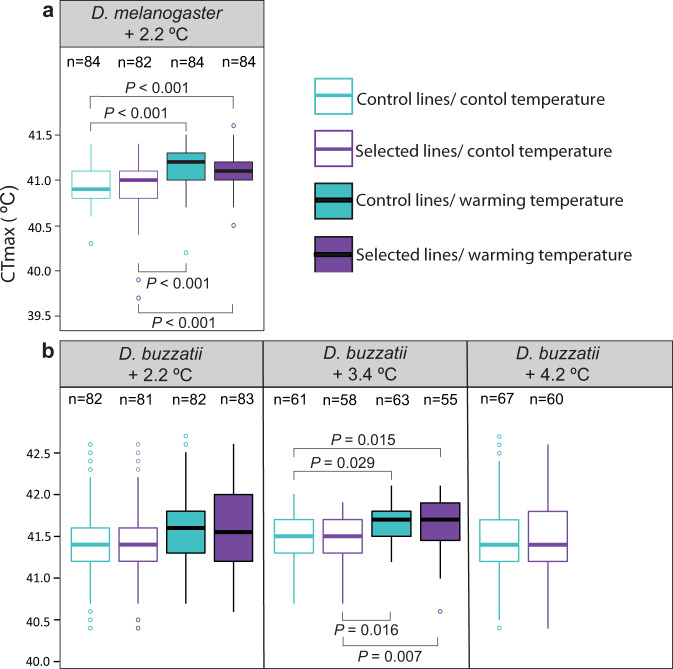
Fig. 5. The response of critical thermal maxima (CTmax) to gradual experimental warming in two species of Drosophila.
Knockdown CTmax (boxplots denoting the median (solid horizontal lines), upper and lower quartiles (boxes), 1.5× interquartile range (vertical lines) and outliers (circles)) across four replicate control (aqua) and four replicate selected (purple) lines of a widespread D. melanogaster after 2.2 °C of warming, and b widespread D. buzzatii after 2.2, 3.4 and 4.2 °C of warming. CTmax was estimated by reciprocally transplanting control and selected lines to developmental temperatures reflecting both the control thermal regime (26 ± 3 °C, open bars) and the warming thermal regime (solid bars) at the generation of testing (e.g., 28.2 ± 3 °C after 2.2 °C of warming). Significant differences (two-sided Tukey post hoc test) between selection lines/developmental temperature within a generation of warming are shown. n = total number of individuals per temperature/treatment. Source data are provided as a Source Data file.

