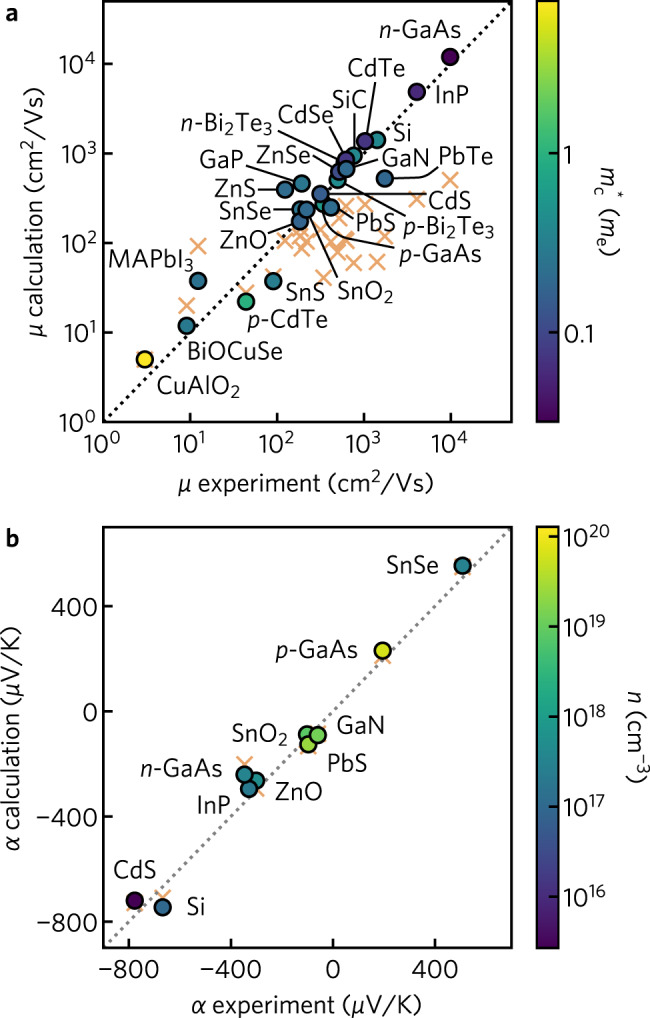
Fig. 4. Calculated mobility and Seebeck coefficient against experiment.

a Comparison of carrier mobilities, μ, at 300 K between calculations and experiments, with points colored by the conductivity effective mass . b Comparison of Seebeck coefficients, α, at 300 K between calculations and experiments, with points colored by the majority carrier concentration n. For Si and CdS we compare directly to the diffusive component of Seebeck coefficient only. CH3NH3PbI3 has been abbreviated as MAPbI3. In (a) and (b), orange crosses indicate results computed using a constant relaxation time of 10 fs. Detailed temperature and carrier concentration results for each material are provided in Supplementary Figs. 8 and 11.
