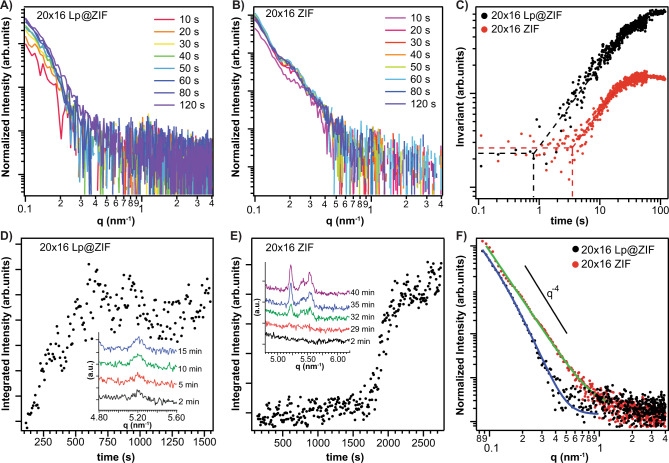
Fig. 3. X-Ray Diffraction Kinetics Study of Biomimetic ZIF Formation.
Time evolution of SAXS patterns (background subtracted) from time‐resolved SAXS synthesis of (A) 20 × 16 Lp@ZIF. 10 s (magenta), 20 s (orange), 30 s (yellow), 40 s (green), 50 s (blue), 60 s (dark-blue), 80 s (light-purple), and 120 s (dark-purple). B 20 × 16 ZIF measured at 10 s intervals. 10 s (pink), 20 s (magenta), 30 s (dark-orange), 40 s (light-orange), 50 s (green), 60 s (blue), 80 s (dark-blue), and 120 s (purple). C Time evolution of invariant Q̃ calculated from 0.1 to 0.6 nm−1 of the time‐resolved SAXS patterns in (A, B) and corresponding to the synthesis of 20 × 16 Lp@ZIF (black dots) and 20 × 16 ZIF-L (red dots). The dashed lines are plotted to highlight the starting time of the Q̃ increase. D Time evolution of the integrated intensity of (200) diffraction peak of ZIF-L (5.25 nm−1) calculated from time‐resolved SAXS synthesis 20 × 16 Lp@ZIF and (E) 20 × 16 ZIF-L. In the insets, selected diffraction patterns highlighting the time-evolution of the (200) diffraction peak of ZIF-L (5.25 nm−1) are reported. Color scheme for (D): 2 min (black), 5 min (red), 10 min (green), and 15 min (blue), and E: 2 min (black), 29 min (red), 32 min (green), and 35 min (blue), and 40 min (purple). Time zero is referred to the end of the precursors mixing. F SAXS patterns (background subtracted and averaged) and fitted data 120 s after mixing the precursors of 20 × 16 Lp@ZIF (black dots) and 20 × 16 ZIF-L (red dots). The theoretical Porod power law (I(q) q−4) is plotted for comparison.

