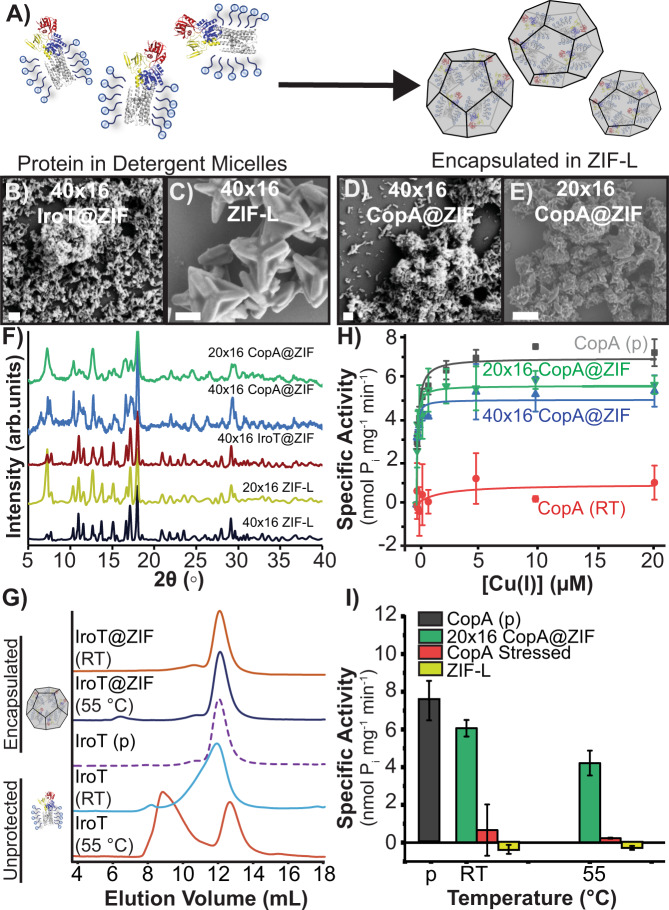
Fig. 4. IroT@ZIF and CopA@ZIF characterization.
A Biomolecular nucleation of detergent stabilized CopA and IroT in ZIF. SEM micrographs of (B) 40 × 16 IroT@ZIF (Scale bar = 200 nm) and (C) 40 × 16 ZIF-L (Scale bar = 1 μm). SEM micrographs of (D) 40 × 16 CopA@ZIF (Scale bar = 200 nm) and (E) 20 × 16 CopA@ZIF (Scale bar = 1 μm). F PXRD of 40 × 16 IroT@ZIF (brown), 40 × 16 CopA@ZIF (blue), 20 × 16 CopA@ZIF (green), 20 × 16 ZIF-L (yellow), and 40 × 16 ZIF-L (black). Y-axis expressed as arbitrary units (arb. units). G SEC traces of heated IroT@ZIF bio-composites against native and nonencapsulated IroT. IroT@ZIF RT (orange), Lp@ZIF 55 °C (blue), IroT pristine (purple-dashed line), IroT RT (blue), and IroT 55 °C (dark-orange). H ATPase activity analysis of CopA pristine (gray) against stressed and exfoliated 40 × 16 CopA@ZIF (blue), 20 × 16 CopA@ZIF (green), with unencapsulated control (red line) (Error bars = standard deviation (n = 3)). I Comparison of maximal specific activity in CopA samples and controls (Error bars = standard deviation (n = 3)). CopA pristine (gray), 20 × 16 CopA@ZIF (green), unencapsulated CopA (red), and ZIF-L pristine (yellow).

