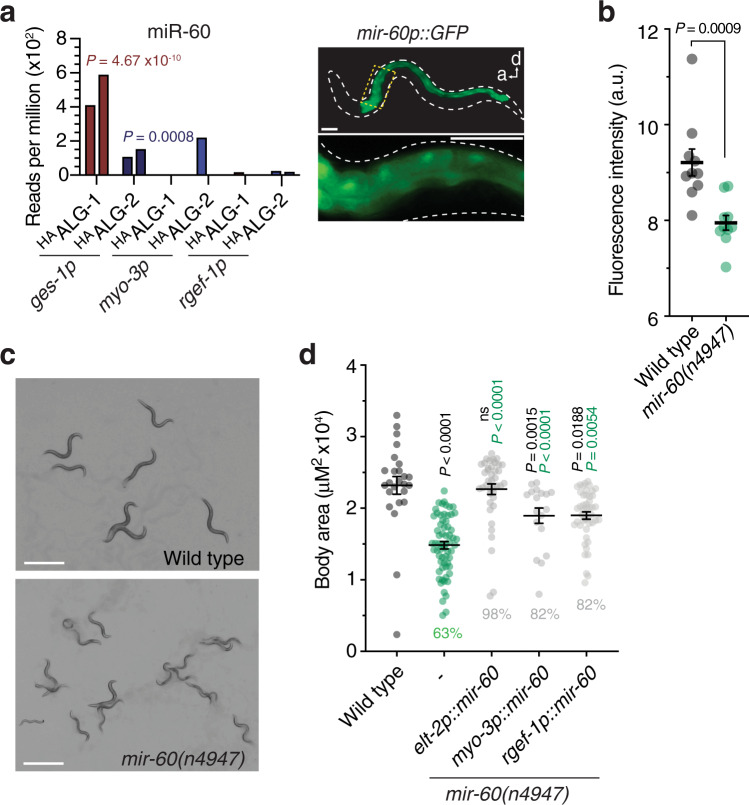
Fig. 6. Functionality of intestine-specific miRNA.
a Read counts showing intestine-specific loading of miR-60 and promoter GFP fusion showing intestine-specific expression. Graph shows reads per million in indicated cell types of two biological replicate experiments, two bars. Scale bars, 50 µm. b Quantification (fluorescence intensity) of fat content using Oil Red O staining on wild-type and mir-60(n4947) starvation-recovered worms. Error bars represent +/− s.e.m of ten independent animals. P value represents a two-way unpaired Students t-test. a.u., arbitrary units. c Wild type or mir-60(n4947) animals after recovery from starvation. Scale bars, 1 mm. d Quantification of body area of cell-type-specific complemented mir-60(n4947). Percentages shown are the relative average body areas of animals compared to wild type. Error bars represent +/− s.e.m. P values represent one-way ANOVA with Tukey’s multiple comparisons test compared to wild type (black values) or mir-60(n4947) animals (green values). n ≥ 18 biologically independent animals for each strain tested.

