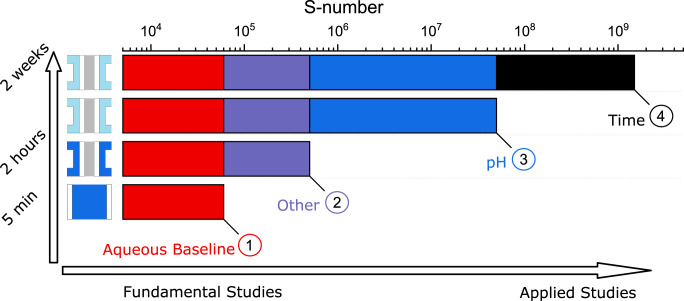
Fig. 6. Scheme on the proposed main contributors to the dissolution discrepancy.
Schematic drawing of the factors contributing to the OER catalyst dissolution discrepancies between AMS and MEA. Measurements in AMS exhibit an S-number of 6 × 10⁴ (1). The discrepancy to an MEA operated with acid (2), showing an S-number of 4 × 10⁵, cannot be pointed to a single factor. Various factors such as flow rate, Nafion content, and timescale have to be taken into account. The discrepancy of the MEA operated with acidic water feed to an MEA operated conventionally with DI water (3) of almost two orders of magnitude, however, is related to a pH shift in the system. With a longer operation time (4), additional stabilization effects in MEA take place. Source data are provided in the source data file.

