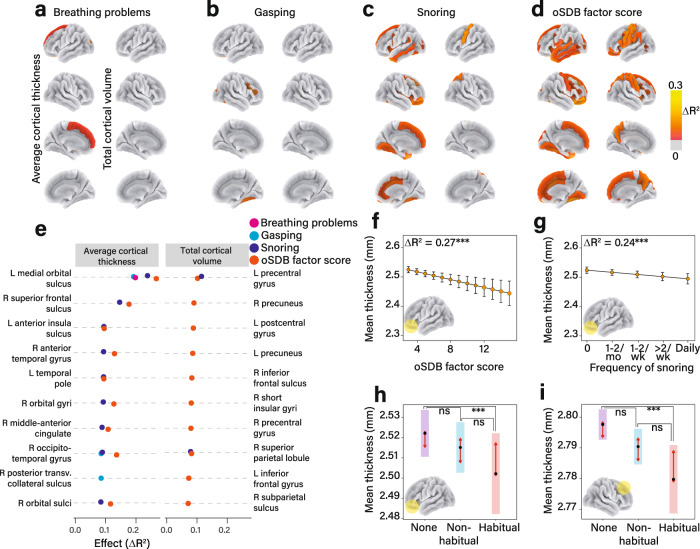
Fig. 3. Obstructive sleep disordered breathing (oSDB) is associated with regional cortical thinning.
a–d Atlas-based effect size maps projected on a cortical surface demonstrate the relationship between the frequencies of individual symptoms, the total oSDB factor score and cortical morphometric variables (average cortical thickness (left) and total volume (right)) measured using magnetic resonance imaging (MRI). Among the individual symptoms, the greatest effect size was identified for the relationship between the frequency of snoring and average cortical thickness (c). The top ten cortical regions of interest (ROI) wherein the strongest effects were identified for each morphometric variable are shown in e. Effect sizes were calculated by measuring the change in overall proportion of variance by adding the predictor to the covariates-only model comprising age, sex, race/ethnicity, and household income as fixed effects and MRI scanner as a random effect. f The covariate-adjusted model for the relationship between oSDB factor score and the mean cortical thickness within the left medial orbital sulcus in 10,140 children. This relationship was replicated for the frequency of snoring as a predictor (g). The error bars in f, g span 95% confidence intervals around the estimated marginal mean cortical thickness. h shows a potential threshold associated with cortical thinning within the left medial orbital sulcus with pairwise comparisons between 661 children who snored habitually (>2 nights a week), and 6040 children who did not snore. However, there was no significant difference between 3439 children who snored non-habitually, defined as less than three nights a week, compared to the non-snoring children. i A similar comparison for the average thickness of the right superior frontal sulcus. A P value threshold of 0.05 was applied to all effect size maps following correction for false discovery. All pairwise comparisons in h and i were adjusted for multiplicity using the Tukey method with the arrows on either side of the estimated mean highlighting the regions of overlap of the estimated marginal means. These tests were two-sided. Cortical surface area was not associated with oSDB or any of the individual symptoms. Source data are provided as a source data file.

