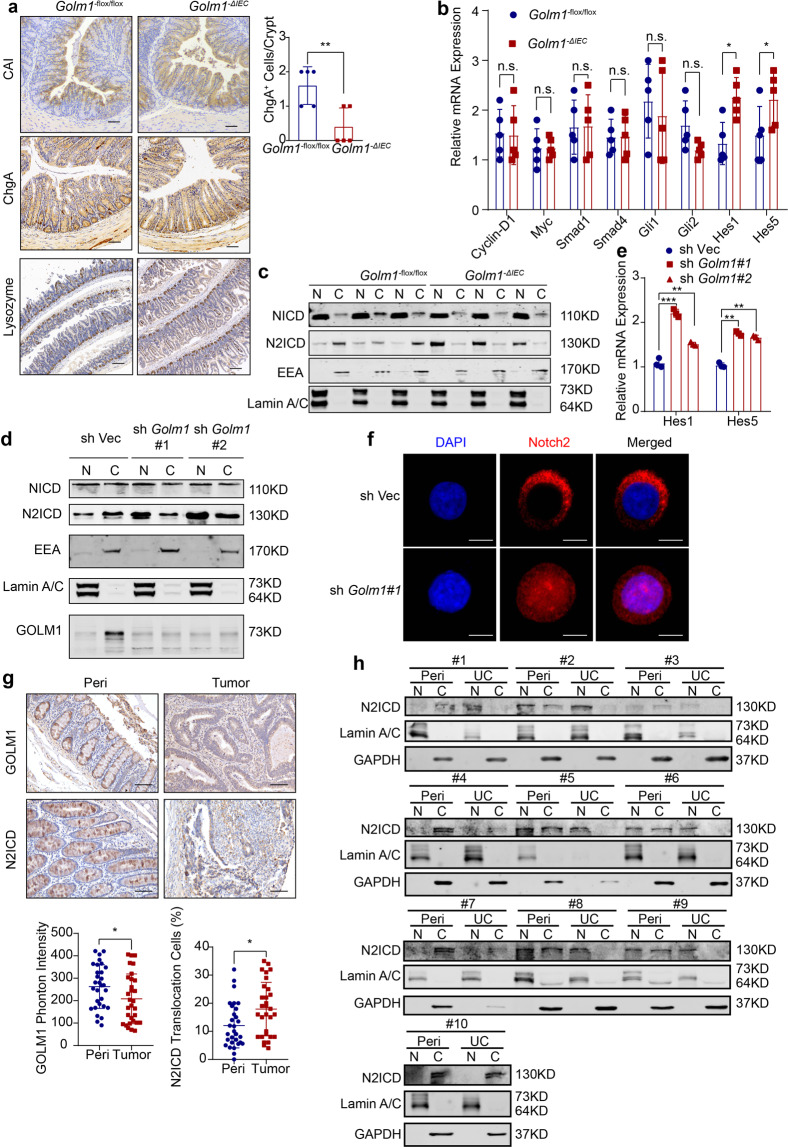
Fig. 5.
GOLM1 deletion causes the nuclear translocation of N2ICD. a Representative CAI and ChgA staining of mouse colon sections and representative Lysozyme staining of mouse small intestine sections obtained from untreated Golm1−ΔIEC and Golm1−flox/flox mice. Scale bars, 100μm. Quantification of ChgA staining is shown in the histogram (the data are represented as the means ± SEM, n = 5; *P < 0.05; unpaired, two-tailed Student’s t test). b The relative mRNA levels of genes that represent the major differentiated signaling pathways in isolated IECs from untreated Golm1−ΔIEC and Golm1−flox/flox mice were determined by qRT-PCR (the data are represented as the means ± SEM, n = 5; *P < 0.05; unpaired, two-tailed Student’s t test). c The separated cytoplasmic and nuclear lysates of IECs isolated from untreated Golm1−ΔIEC mice and Golm1−flox/flox counterparts were analyzed by immunoblotting (n = 3) with indicated antibodies. d Cellular fractionations from GOLM1-deficient Caco-2 cells and control cells were analyzed by immunoblotting with indicated antibodies. e The relative mRNA expression levels of Notch downstream genes in GOLM1-deficient Caco-2 cells and control cells were determined (the data are represented as the means ± SEM, ***P < 0.001; unpaired, two-tailed Student’s t test). f Representative immunofluorescence staining for N2ICD in GOLM1-deficient Caco-2 cells and control cells. Scale bars, 20 μm. g Representative immunochemistry staining for GOLM1 and N2ICD in 30 CRC samples of tissue microarray. Scale bars, 50 μm. IHC images were calculated using Image-Pro Plus (the data are represented as the means ± SEM; *P < 0.05; unpaired, two-tailed Student’s t test). h Cellular fractionations of colons from the UC patients we collected were analyzed by immunoblotting with the indicated antibodies (n = 10)

