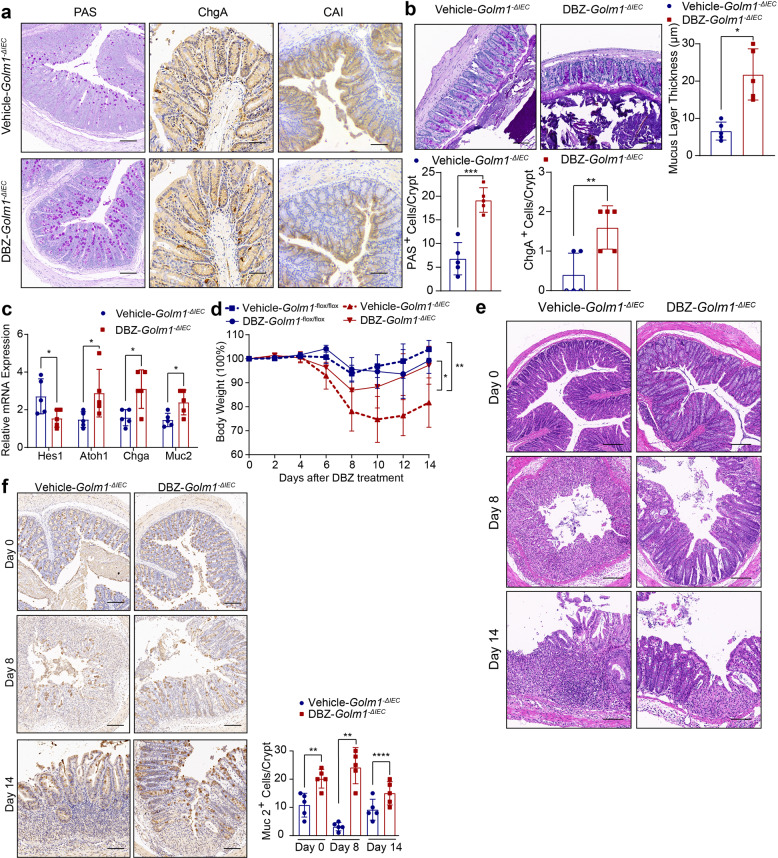
Fig. 7.
Notch inhibitor-DBZ treatment reduces DSS-induced colitis in Golm1−ΔIEC mice. a Representative PAS, ChgA and CAI staining of mouse colon tissues obtained from Golm1−ΔIEC mice injected intraperitoneally with 3 μmol/kg DBZ or vehicle for 5 days. Scale bars, 100 μm. Quantifications of PAS and ChgA staining are shown in the histogram (the data are represented as the means ± SEM, n = 5; **P < 0.01, ***P < 0.001; unpaired, two-tailed Student’s t test). b Representative PAS staining of mouse colon sections fixed by Carnoy’s fluid from Golm1−ΔIEC mice injected intraperitoneally with 3 μmol/kg DBZ or vehicle for 5 days. Scale bars, 50μm. Quantification is shown in the histogram (the data are represented as the means ± SEM, n = 5; **P < 0.01; unpaired, two-tailed Student’s t test). c The relative mRNA expression levels of the indicated genes in the distal colon of mice determined by qRT-PCR after DBZ/vehicle treatment. The relative expression reflects the fold change calculated by comparing with the expression levels in untreated Golm1−ΔIEC mice (the data are represented as the means ± SEM, n = 5; *P < 0.05; unpaired, two-tailed Student’s t test). d The body weights of Golm1−flox/flox and Golm1−ΔIEC mice treated with 2% DSS followed by DBZ administration were recorded on indicated days (the data are represented as the means ± SEM, n = 5; *P < 0.05, **P < 0.01). e Representative H&E staining of mouse colon sections obtained from DBZ/vehicle-DSS-treated Golm1−ΔIEC mice sacrificed on indicated days. Scale bars, 100 μm. f. Representative MUC-2 staining of mouse colon sections obtained from Golm1−ΔIEC mice treated with 2% DSS plus DBZ and sacrificed on indicated days. Scale bars, 100μm. Quantification is shown in the histogram (the data are represented as the means ± SEM, n = 5; **P < 0.01, ***P < 0.001; unpaired, two-tailed Student’s t test)

