
Fig. 2. Principal component analysis reveals primary effect of sex on gene expression.
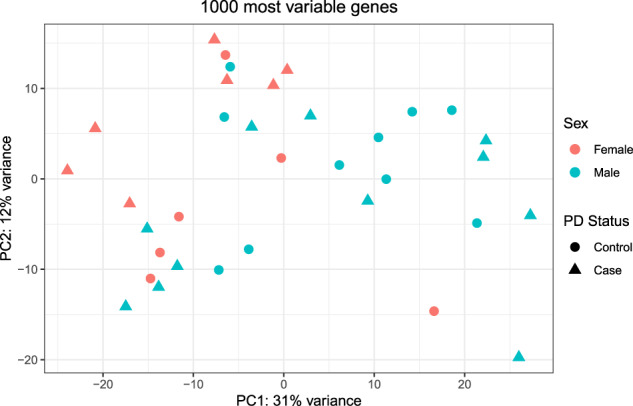
Principal Component Analysis (PCA) of the 1000 most variably expressed genes in monocytes from our RNA-seq dataset was conducted and the first two principal components were plotted. A primary effect of sex on gene expression was observed. Circles represent healthy control subjects (n = 16) and triangles represent PD subjects (n = 18); females (n = 13) are filled orange and males (n = 21) are filled light blue.