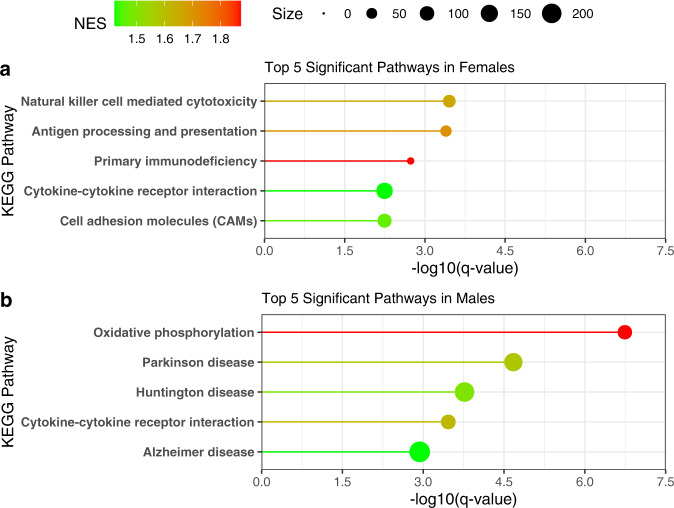
Fig. 6. Immune pathways are disrupted between PD and HC in both sexes.
Pathway analysis was conducted using Gene Set Enrichment Analysis (GSEA) and the human Kyoto Encyclopedia of Genes and Genomes (KEGG) pathways in females (a) and males (b), separately. Genes ranked by the absolute value of the Wald test statistic generated by differential expression analysis between PD and HC were utilized in the analysis. The KEGG pathway name is labeled on the y-axis, the -log10 of the q-value is plotted on the x-axis, the line and dot plotted are colored by the normalized enrichment score (NES) with the highest NES plotted in red and the lowest (from the significant pathways plotted) in green. The size of the dot in the figure represents the number of genes from our input that were in that specific pathway.

