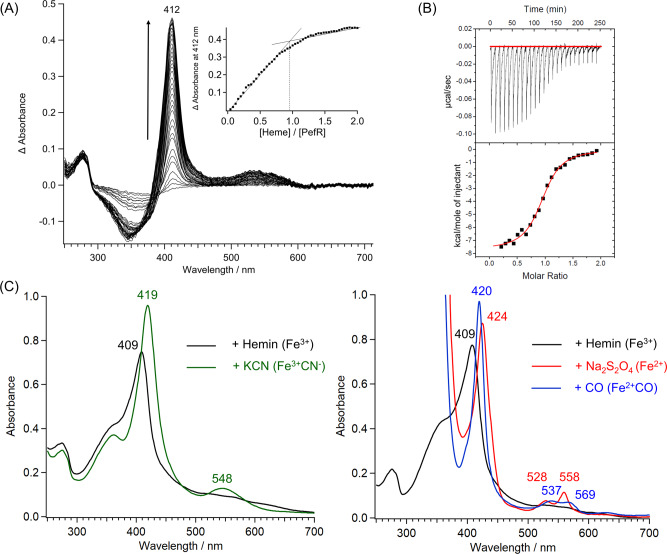
Fig. 4. Heme-binding properties of PefR.
A Spectral change upon ferric hemin addition. Inset, titration curve of hemin binding to apo-PefR measured at 412 nm. A dimer of PefR binds two hemes, and the stoichiometry is 1:1 when considering a monomer PefR. B ITC of heme binding to apo-PefR. Top panel, differential heating power versus time. Lower panel, integrated and normalized heat of reaction versus the molar ratio. Experimental data are shown by black squares. Red lines show the best fit to the binding isotherm using a one-site binding model. C Optical absorption spectra of PefR (5 μM) in Fe3+, Fe3+CN− (left panel), and Fe3+, Fe2+, and Fe2+CO (right panel) in 40 mM Tris/HCl (pH 7.4) and 500 mM NaCl.

