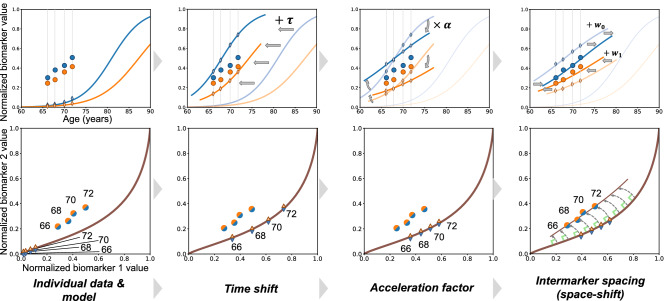
Figure 1.
Disease course mapping for two biomarker data. Top left panel: the model as plain curves and repeated data of one subject. x-axis is age in years and y-axis is the normalized values of the biomarkers. Top row, three left panels: the three operations used to mapping the model to the individual data: the time-shift translates the curves, the acceleration factor scales the abscissa, the space-shifts change the time interval between both curves. Bottom row shows another representation of the same data as parametric curves. Panels plot the values of one biomarker versus the other one, time being the parameter. Data fall within a unit square, which is a particular case of a Riemannian manifold. The model is a geodesic curve and the transformed curve is a change in the parametric representation of the geodesic followed by exp-parallelisation, a generalisation of translation on manifolds. This construction for two biomarker data extends therefore to any kind of data on a Riemannian manifold.

