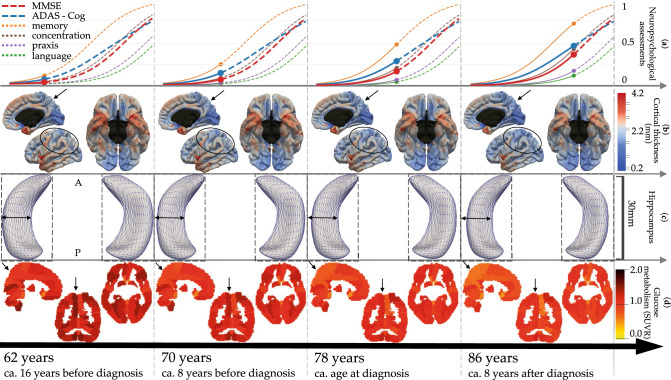
Figure 2.
Normative models of Alzheimer’s disease progression shown at 4 Alzheimer Age with estimated time until/from diagnosis. Bottom to top rows show alteration of brain glucose metabolism, hippocampus atrophy, cortical thinning and onset of cognitive decline. Black arrows and ellipses indicate some areas of great changes. Images were obtained using the freely available software FSLeyes v.0.22.6 (https://fsl.fmrib.ox.ac.uk/fsl/fslwiki/FSLeyes) and Paraview v.5.2.0 (www.paraview.org).

