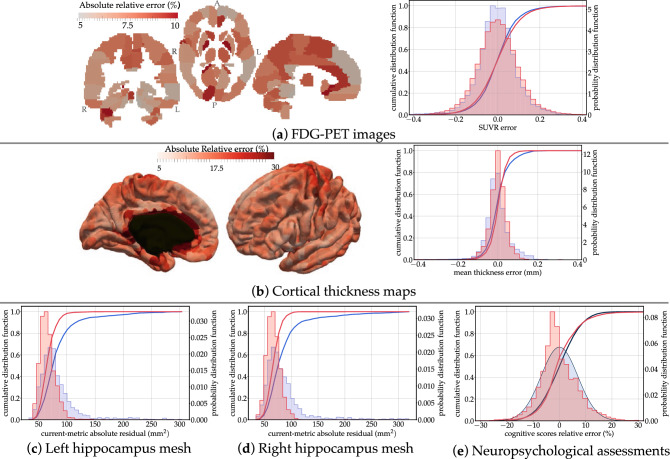
Figure 3.
Distributions of reconstruction errors. The empirical distribution of errors (red) is superimposed with the estimated distribution of test / re-test differences (in blue). The absolute relative error is shown in every brain region for FDG-PET images and cortical thickness maps. Mean and standard errors are given in Supplementary Table S1. Images were obtained using the freely available software FSLeyes v.0.22.6 (https://fsl.fmrib.ox.ac.uk/fsl/fslwiki/FSLeyes) and Paraview v.5.2.0 (www.paraview.org).

