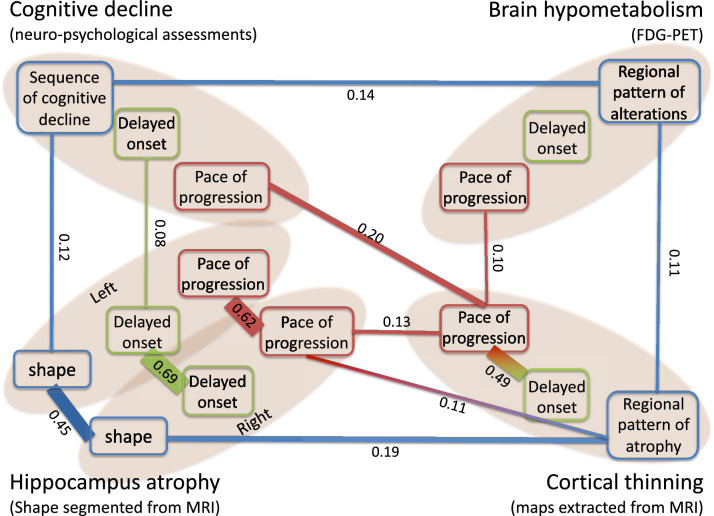
Figure 6.
Graph of conditional correlations among individual parameters. An edge is shown between two parameters if there is a significant correlation between them given all other parameters. The width of the edge is proportional to the value of the conditional correlation, which is also reported on the edge. The color of the parameter denotes its type and its position the modality. The image was obtained using the software Microsoft PowerPoint v.16.43.

