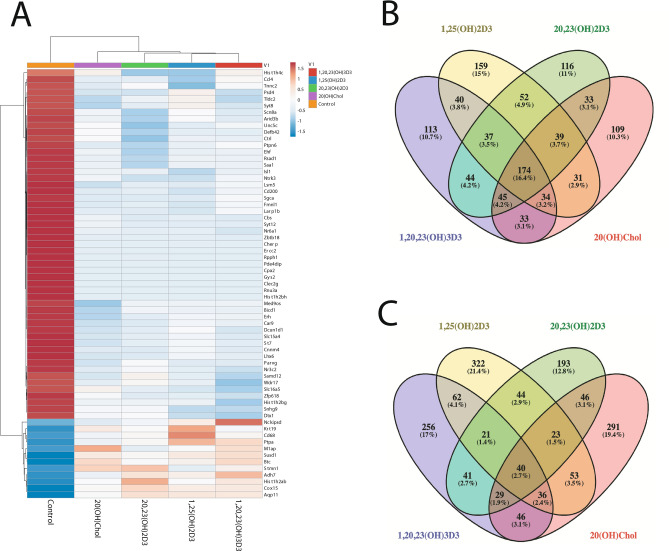
Figure 2.
RNAseq analysis of changes in gene expression in murine dermal fibroblasts treated with 10–7 M 1,25(OH)2D3, 20,23(OH)2D3, 1,20,23(OH)3D3 or 20(OH)cholesterol (20(OH)C, a native LXR ligand) for 24 h. Heat map of the gene expression pattern (A) with corresponding Venn diagrams shown for down (B) or upnregulated (C) protein coding genes for absolute fold change ≥ 2 cutoff. The Venn diagrams were prepared using Venny version 2.1.0: https://bioinfogp.cnb.csic.es/tools/venny/index.html. The heatmap was prepared using ClustVis: https://biit.cs.ut.ee/clustvis/.

