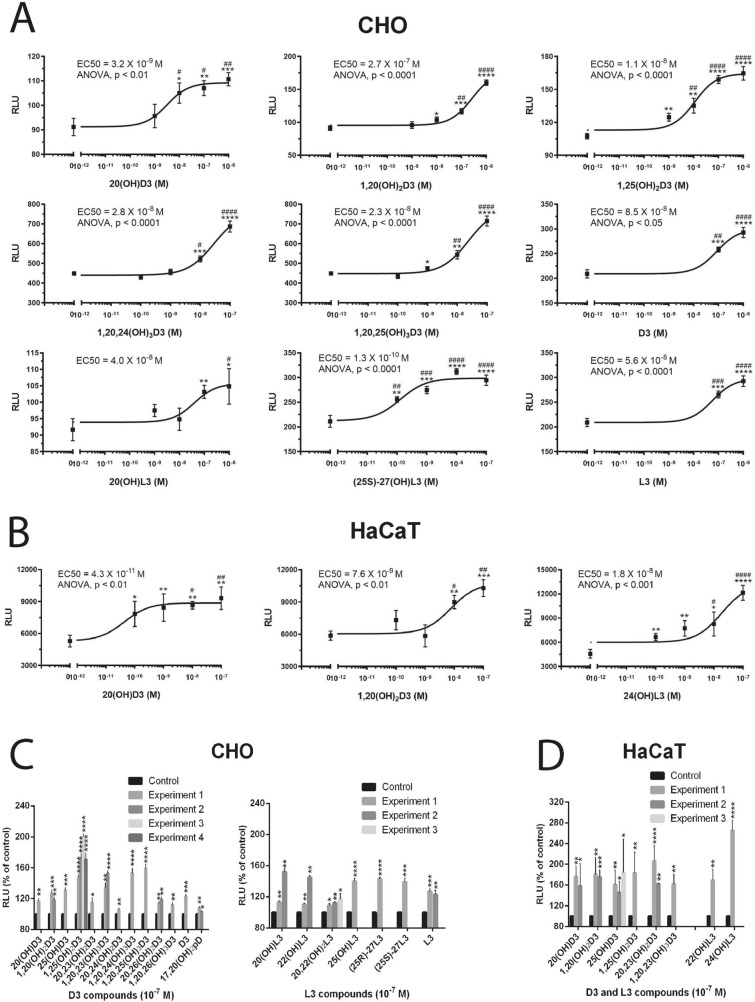
Figure 4.
L3 and D3-derivatives activate a LXR-response element (LXRE)-driven reporter in CHO cells (A,C) and human HaCaT keratinocytes (B,D). Representative dose response curves are in (A) and (B), while a summary of assays performed with 10–7 M ligands is presented for each experiment separately for CHO cells (C) and HaCaT keratinocytes (D). Data are presented as means ± SE, (n = number of assays). Analysis was done using one-way ANOVA for dose responses and the t-test: *p < 0.05, **p < 0.01, ***p < 0.001 or ****p < 0.0001 versus control (ethanol).

