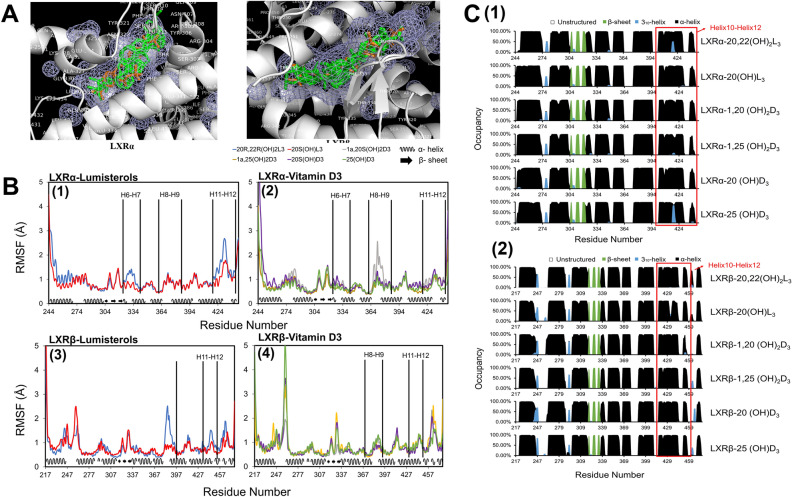
Figure 7.
(A) Binding modes for the selected four D3 derivatives (1,20(OH)2D3, 1,25(OH)2D3, 20(OH)D3, and 25(OH)D3) and two L3 derivatives (20,22(OH)2L3, 20(OH)L3) and co-crystalized ligands in the ligand binding domain (LBD) of LXRα (PDBID:5AVI) and LXRβ (PDBID:5HJP). Docked poses of the studied ligands are shown in green and the co-crystallized ligands in LXRα and in LXRβ are shown in light brown. The mesh areas shown in the figure are hydrophobic binding regions in LXRs. (B,C) are based on last 150 ns of the equilibrated MD trajectories (B) Different L3 and D3 derivatives resulted in varied degrees of conformational fluctuation for the residues between helices in the LBDs of LXRα and LXRβ. (C) Different L3 and D3 derivatives could result in the small secondary structure changes of helix 10 to helix 12 for both LDB of LXRα and LXRβ. Image for (A) is made with PyMOL (v2.4.0, https://pymol.org/2/)99 based on our molecular docking results. Image for (B) is made with Microsoft Excel (v2019, https://office.microsoft.com/excel)100 based on the root mean square fluctuation (RMSF) analysis of our molecular dynamics simulation trajectories. Image for (C) is made with Microsoft Excel (v2019, https://office.microsoft.com/excel)100 based on the secondary structural analysis of our molecular dynamics simulation trajectories.

