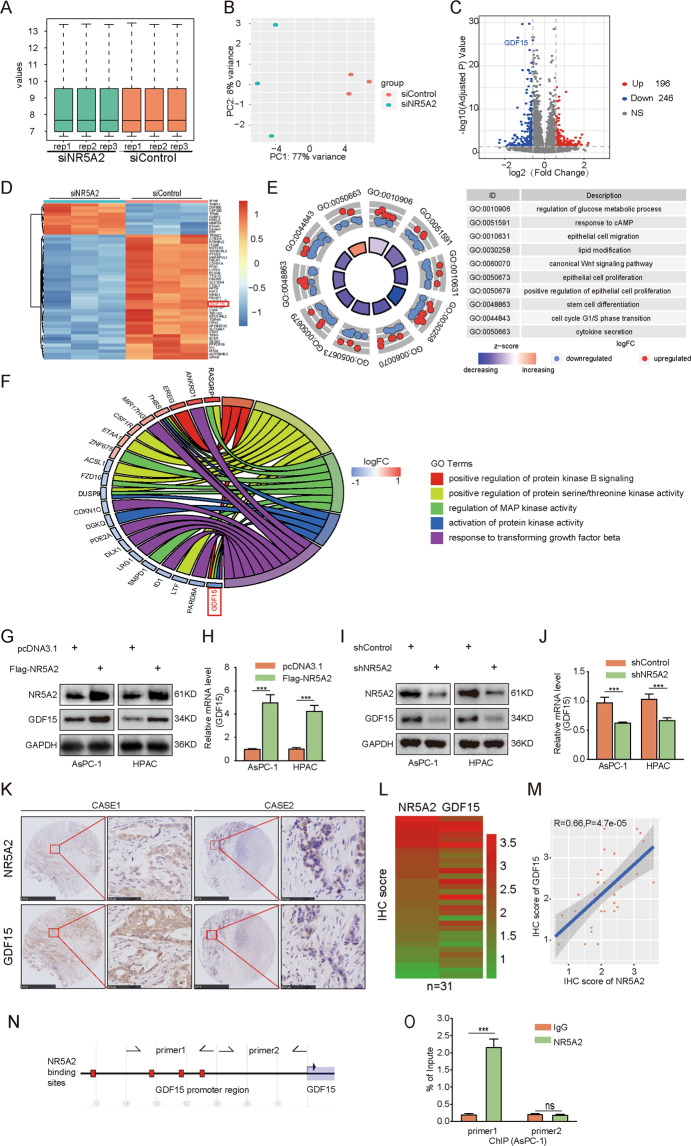
Fig. 5. Overexpressed NR5A2 transcriptionally increased the expression of GDF15 in pancreatic cancer.
A, B PANC-1 cells infected by siControl or siNR5A2 were harvested for Transcriptome RNA sequencing. Boxplot (A) and Principle Component Analysis (B) to show the quality control of RNA sequencing. C, D Volcano map (C) and heat map (D) to show that GDF15 was significantly downregulated in NR5A2 silenced PANC-1 cells. E Gocircle plot to show that several cancer-related GO terms were downregulated in NR5A2-silenced PANC-1 cells. F GO Chord plot indicated that GDF15 was a component of multiple downregulated tumor-promoting gene sets. G, H. AsPC-1 and HPAC cells infected with shControl or shNR5A2 were harvested for Western blots (G) and RT-qPCR analysis (H). GAPDH served as an internal reference. All the data are mean ± S.D. from experiments with three replicates. ***p < 0.001. Statistical analyses were performed using an unpaired t test. I, J. AsPC-1 and HPAC cells infected with pcDNA3.1 or NR5A2 plasmid were harvested for Western blots (I) and RT-qPCR analysis (J). GAPDH served as an internal reference. All the data are mean ± S.D. from experiments with three replicates. ***p < 0.001, unpaired t test. K–M IHC Images (K) of NR5A2 and GDF15 staining using TMA tissue sections (n = 31). The scale bars were shown as indicated. Heatmap (L) and dot plot (M) to show the correlation of IHC scores for the expression of the NR5A2 and GDF15 proteins in pancreatic cancer patient specimens. (r = 0.66 for spearman correlation coefficients, p = 4.7e−05). N The GDF15 promoter sequences and putative NR5A2 binding sites were obtained from the Eukaryotic Promoter Database (EPD) (https://epd.epfl.ch//index.php). O ChIP-qPCR of NR5A2 in AsPC-1 and HPAC cells. All data are shown as the mean values ± SD from three replicates. ns not significant; ***p < 0.001, unpaired t test.

