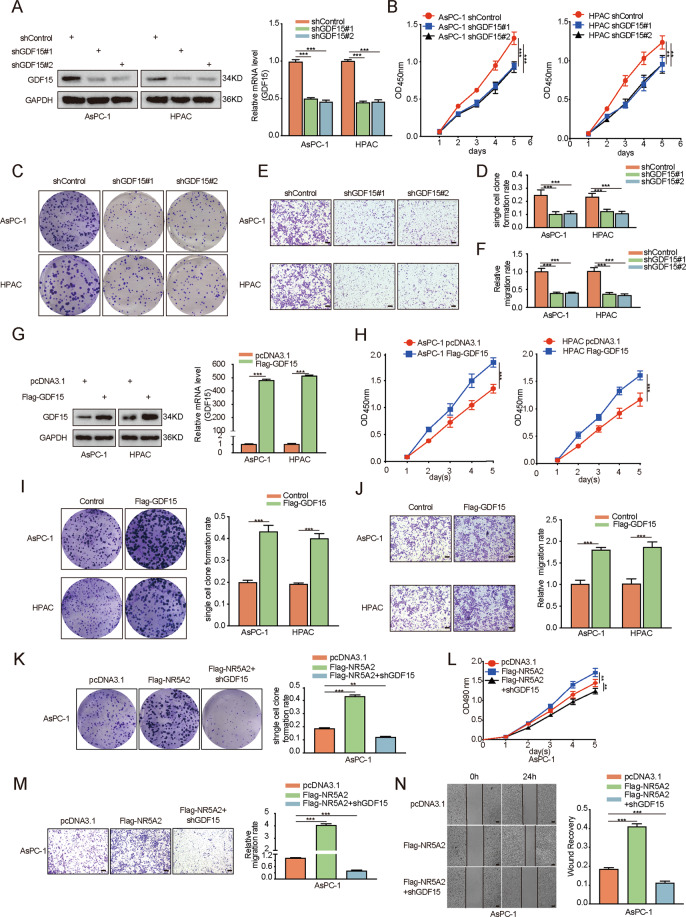
Fig. 6. NR5A2 promoted the potential malignancy of pancreatic cancer by upregulating GDF15 expression in vitro.
A Western blot analysis and RT-qPCR to show the GDF15 expression in AsPC-1 and HPAC cells infected with pcDNA3.1 or GDF15 plasmid. GAPDH served as an internal reference. Data presented as the mean ± SD of three independent experiments, ***p < 0.001, one-way ANOVA. B–F AsPC-1 and HPAC cells infected with pcDNA3.1 or GDF15 plasmid were harvested for MTS assay (B, n = 5), colony formation assay (C, D), and transwell invasion assay (E, F). Each bar represents the mean ± SD of three independent experiments. ***p < 0.001, one-way ANOVA. G Western blot analysis and RT-qPCR to show the GDF15 expression in AsPC-1 and HPAC cells infected with shControl or shGDF15. GAPDH served as an internal reference. Data presented as the mean ± SD of three independent experiments, ***p < 0.001, unpaired t test. H–J AsPC-1 and HPAC cells infected with shControl or shGDF15 were harvested for MTS assay (H, n = 5), colony formation assay (I), and transwell invasion assay (J), scale bars: 100 μm. Each bar represents the mean ± SD of three independent experiments. ***p < 0.001, unpaired t test. K–M AsPC-1 cells infected with pcDNA3.1, NR5A2, or NR5A2 + shGDF15 were harvested for colony formation assay (K), MTS assay (L, n = 5), Invasion assay (M) and wound healing assay (N), scale bars: 100 μm. Each bar represents the mean ± SD of three independent experiments. ***p < 0.001, one-way ANOVA.

