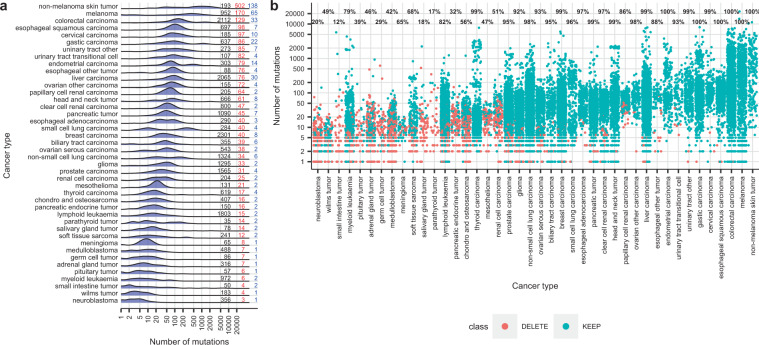
Fig. 1. Mutations in the tumor samples of COSMIC v84 (training dataset).
a Distribution of TMBs across 42 cancer types in the 24,726 samples of the training dataset. The “Y” axis corresponds to the frequency of mutant samples. Numbers on the right of the plot indicate: black, number of samples included in the analysis; red, median TMBs; blue, median of common mutant genes. Cancer types are ordered by median TMBs. b Number of mutations in the individual tumor samples of COSMIC v84. Each dot represents a sample. In blue, samples conserved for the development of panels for TMB prediction, in red samples discarded. Numbers on top of each cancer type are the percentage of conserved samples.

