Figure 3.

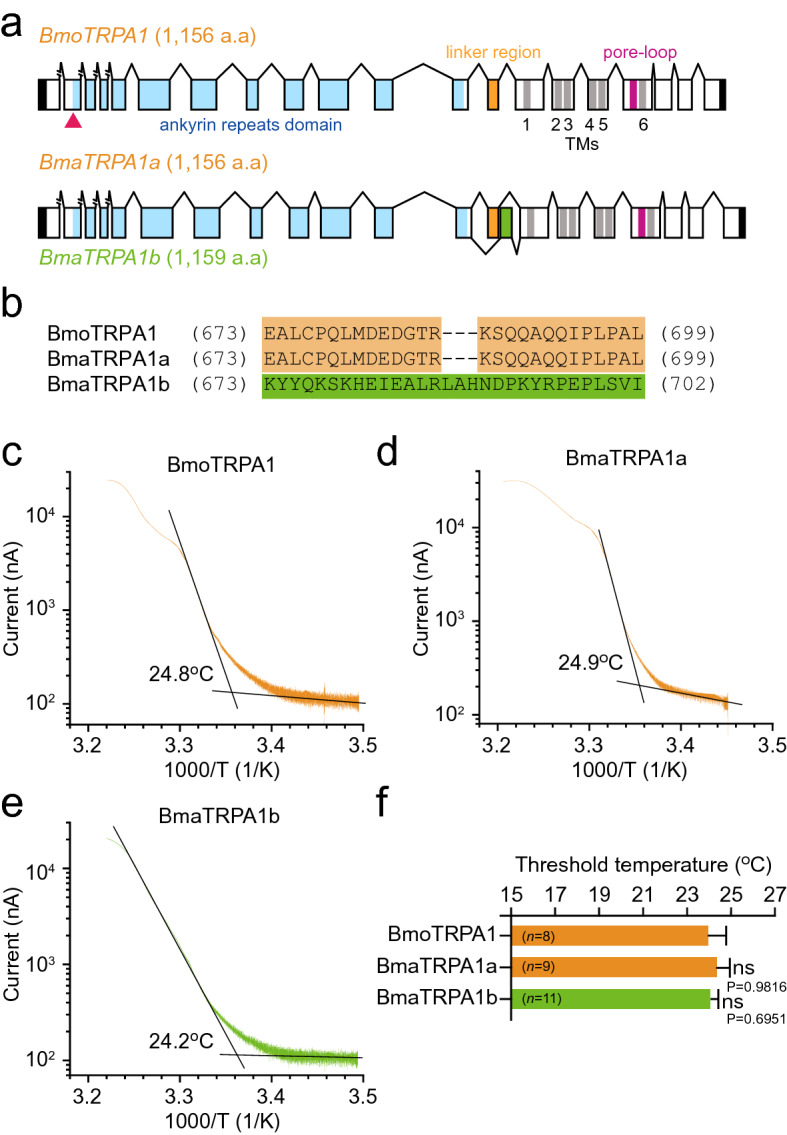
Cloning and functional analysis of Bombyx mori and B. mandarina TRPA1. (a) Schematic representations of the B. mori TRPA1 (BmoTRPA1), B. mandarina TRPA1a (BmaTRPA1a), and TRPA1b (BmaTRPA1b). Boxes and lines represent exons and introns, respectively. Black, blue, orange, gray, and red boxes represent domains of untranslated regions, ankyrin repeat, linker region, transmembrane (1 ~ 6), and pore-loop, respectively. The red triangle indicates the TALEN target site. (b) Sequence alignment of the linker region between TRPA1s. (c–e) Arrhenius plots for the heat-induced BmoTRPA1, BmaTRPA1a, and BmaTRPA1b current shows a clear flex point in temperature dependency. Each temperature threshold for TRPA1 activation was defined as when the two linear-fitted lines crossed (i.e., a flex point). (f) Comparison of threshold temperature for each TRPA1. Each bar represents the mean ± SEM of 8–11 samples. Significant differences versus BmoTRPA1 were evaluated. ns, non-significant.
