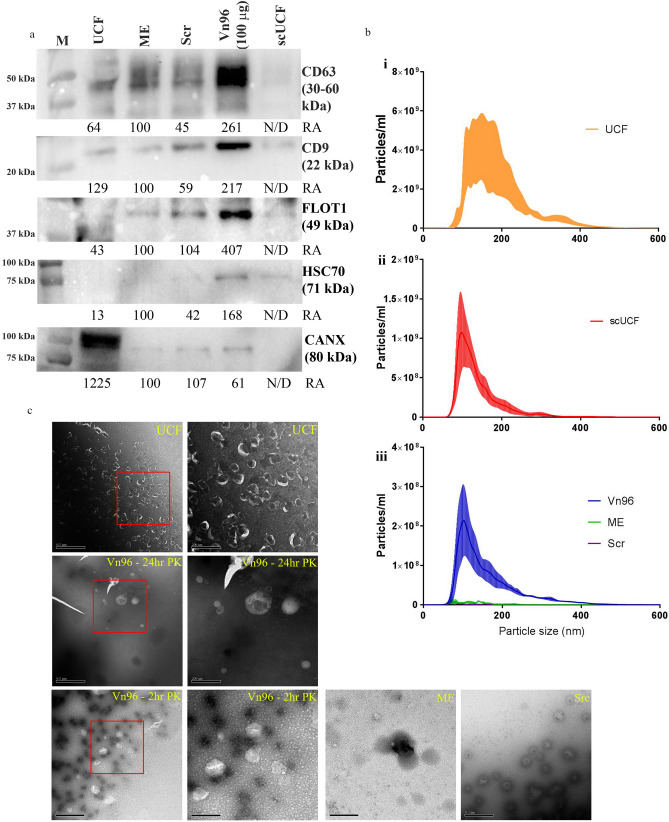
Figure 2.
Characterization of plasma EVs isolated by UCF, scUCF and Vn96 methods, all from the same donor plasma (n = 3). (a) Representative Western blot comparing different EV isolation methods probing for canonical EV markers: CD63 (65 kDa), CD9 (24 kDa), FLOT1 (50 kDa), HSC70 (73 kDa), and cytoplasmic marker CANX (75 kDa). Mean relative abundance (RA) for three experiments is indicated below each Western blot (ME is set at 100). Full-length blots and all biological replicates are presented in Supplementary Fig. 3. (b) NTA results showing the number of particles ± SEM per mL of starting plasma on the y-axis plotted against the size (nm) of particles on the x-axis from UCF (i), scUCF (ii), and Vn96 with appropriate controls (iii). (c) Representative TEM images of EVs captured by UCF, Vn96 (2 h and 24 h post proteinase K treatment), ME buffer and Scr peptide.

