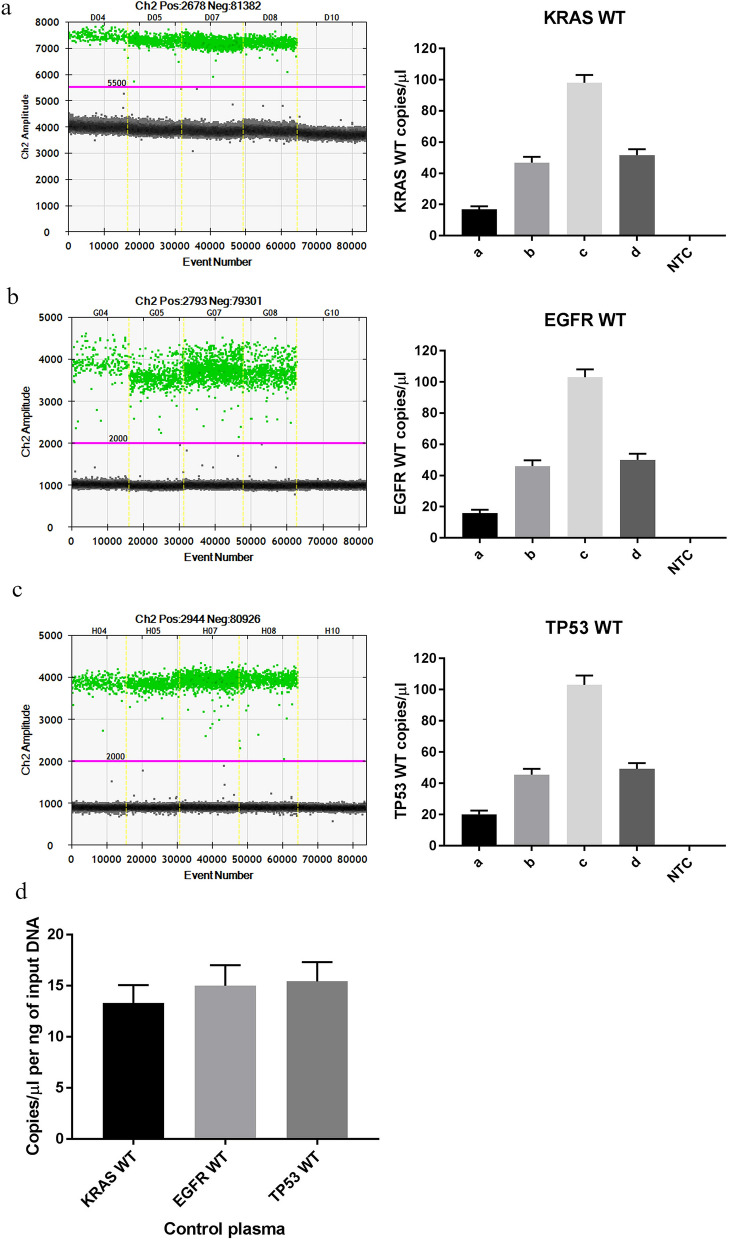
Figure 4.
ddPCR analysis of DNA extracted from Vn96-isolated EVs from control patient plasma (n = 4). (a) KRAS WT ddPCR amplitude vs event number graph (left) and resulting KRAS WT copies ± Poisson confidence min and max for each control patient. Images were generated from BioRad QuantaSoft software (v1.7.4, https://www.bio-rad.com/en-ca/sku/1864011-quantasoft-software-regulatory-edition?ID=1864011, accessed on 28/01/2021). (b) EGFR WT ddPCR amplitude vs event number graph (left) and resulting EGFR WT copies ± Poisson confidence min and max for each control patient. (c) TP53 WT ddPCR amplitude vs event number graph (left) and resulting TP53 WT copies ± Poisson confidence min and max for each control patient. (d) Average normalized to DNA input copies ± SEM for KRAS WT, EGFR WT and TP53 WT (n = 4).

