Figure 5.
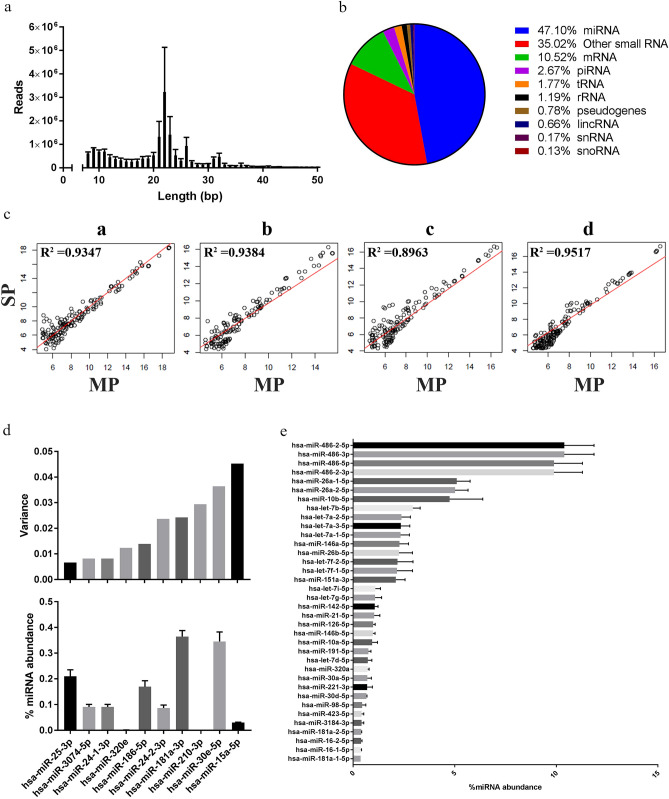
Small RNA sequencing (sRNAseq) results for RNA extracted from Vn96-isolated plasma EVs (n = 4). (a) Average number of reads ± SEM versus read length (bp). (b) Distribution of sRNA species in Vn96-isolated plasma EVs. (c) Regression plot of each patient miRNA result extracted by single parametric (SP) versus multiparametric (MP). (d) Top ten lowest variant miRNA (top) compared to their % of total miRNA abundance ± SEM (bottom). (e) Top 36 abundant miRNA expressed as % of total miRNA abundance ± SEM.

