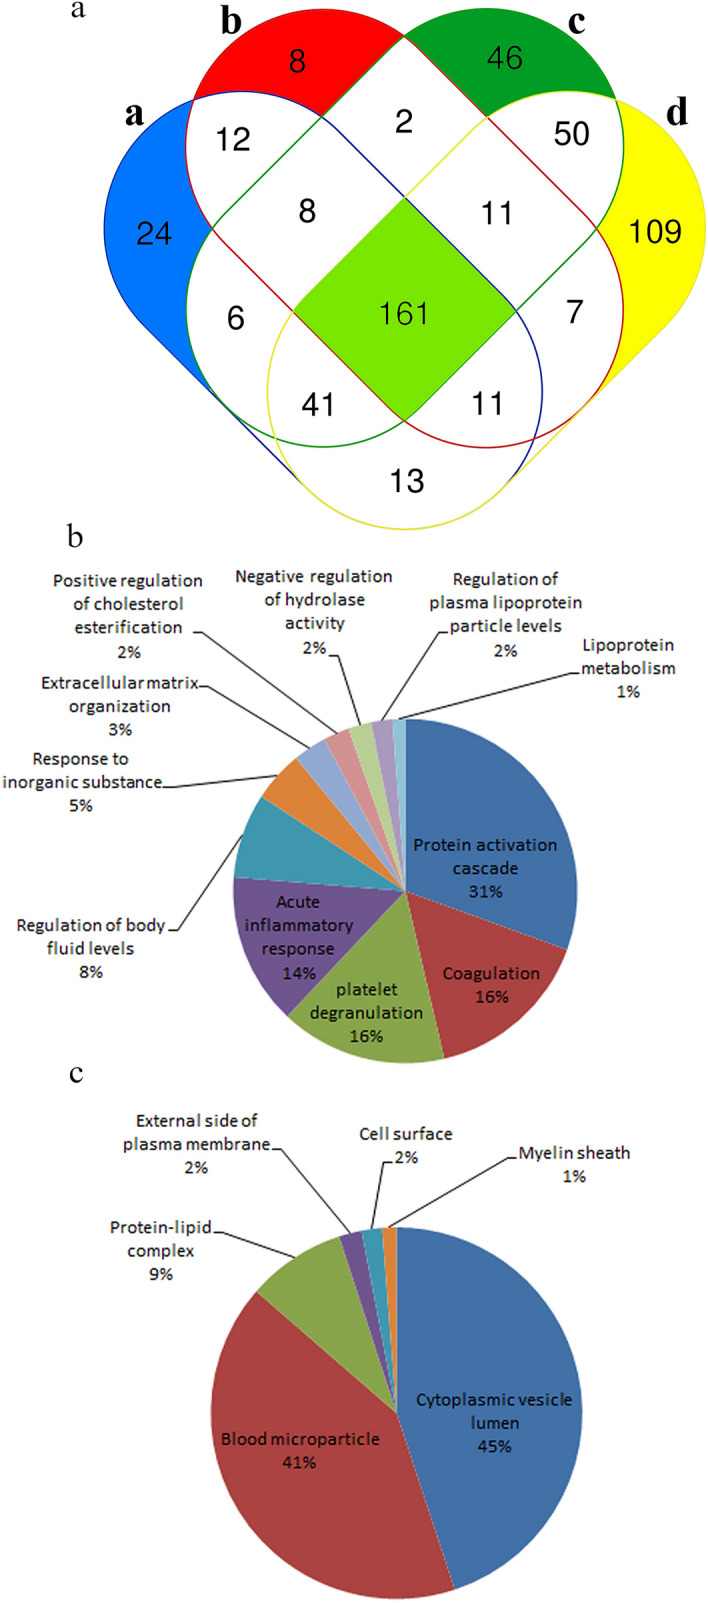
Figure 6.

Mass spectrometry results for proteins extracted from Vn96-isolated plasma EVs (n = 4). (a) Venn diagram demonstrating the overlap of proteins from each patient. A web-based tool was used to generate Venn diagrams (http://bioinformatics.psb.ugent.be/webtools/Venn/, accessed on 28/01/2021). Gene ontology analysis categorized by biological process (b) and cell component (c). Revigo web-based tool was used to generate figures. 24
