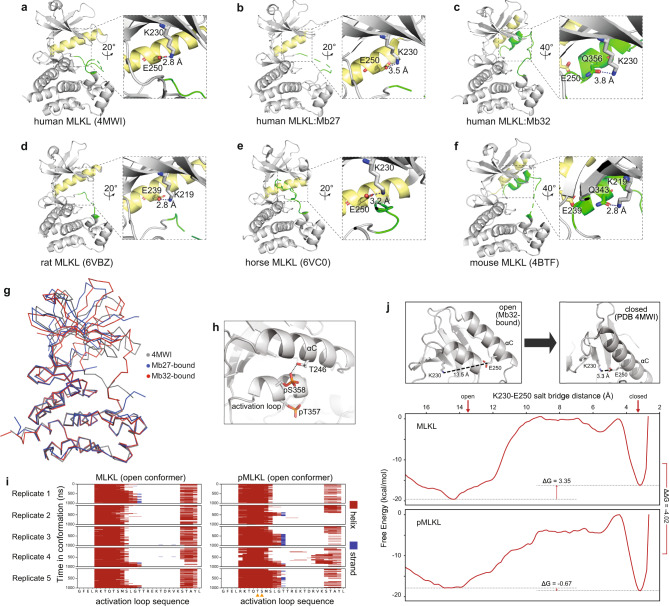
Fig. 3. Human MLKL exists in two distinct conformations.
a–f A comparison of the unliganded human MLKL pseudokinase domain structure (a; PDB accession 4MWI)45, the human MLKL pseudokinase domain from the Mb27 (b) and Mb32 (c) complexes and the rat (d; PDB accession 6VBZ)35, horse (e; PDB accession 6VC0)35; and mouse (f; PDB accession 4BTF)6 MLKL pseudokinase domain structures. Residues of the R-spine are shown as sticks in (b, c). Zoomed panels show the human MLKL K230–E250 (or equivalent residues in ortholog structures) salt bridge between the β3 strand ATP-binding lysine and the glutamate in the αC helix (yellow). A glutamine from the activation loop (green) helix hydrogen bonds with the β3 strand ATP-binding lysine in the open kinase conformation in mouse MLKL and the Mb32-bound human MLKL structure. g Overlaid Cα backbone traces of the previously-reported human MLKL pseudokinase domain structure (PDB 4MWI; gray)45 and the Mb27- (blue) and Mb32 (red)-bound MLKL conformers reported herein. h Model illustrating the stable hydrogen bond between T246 on the αC helix and pS358 on the activation loop helix of human MLKL observed in molecular dynamics simulations. i Molecular dynamics simulations of the human MLKL pseudokinase domain open conformer containing the activation loop helix (from the Mb32 complex structure) at the microsecond timescale. Dephosphorylated MLKL is shown on the left and phosphorylated MLKL is shown on the right. Phosphorylated residues pT357 and pS358 are marked with oranges triangles below the sequence of pMLKL. Helices are marked in red and β-strands are marked in blue. Five independent replicates are shown. j The transition from open, Mb32-bound conformation to the closed conformation (from PDB, 4MWI45; top) was simulated and the two free energy surfaces along the reaction coordinate calculated as a function of the K230–E250 salt-bridge distance (lower). The ΔG was calculated as the difference between local free energy minima before and after 10 Å. Shown on the right, ΔΔG = −4.02 kcal/mol indicates the change in ΔG upon phosphorylation. A negative value suggests that phosphorylation stabilizes the closed, active-like conformation.

