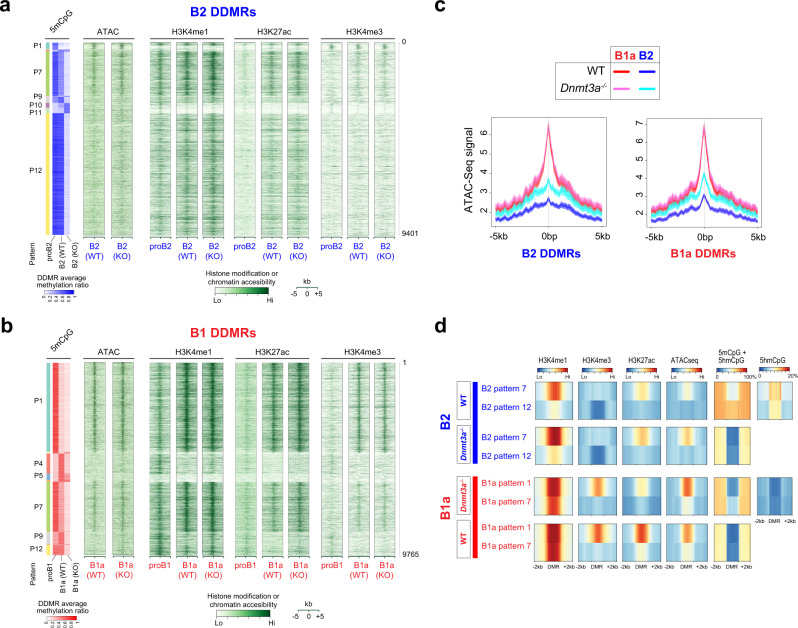
Fig. 6. DDMRs exhibit enhancer marks that are modulated by CpG modification patterns.
a and b 5mCpG, H3K4me1, H3K27Ac, H3K4me3 and ATAC-Seq signal in B2 and B1a DDMRs in proB, WT B and Dnmt3a-/- B cells in the B1a and B2 lineages, respectively. An aggregate signal derived from 3 to 4 ATAC-Seq or CUT&RUN replicates per condition is plotted. The average CpG methylation ratio within the B1a and B2 DMRs is reproduced from Fig. 5E to provide a frame of reference alongside a heatmap of histone modifications, as measured by CUT&RUN or chromatin accessibility signals in 100 bp bins in ±5 kb regions from the center of the DMRs. The six main patterns of methylation are labeled. c Profiles of chromatin accessibility in B1a and B2 DDMRs as measured by ATAC-seq. d The average profile of modified CpGs, H3K4me1, H3K4me3, H3K27ac, and chromatin accessibility in the two largest patterns of B1a and B2 DDMRs in WT and Dnmt3a-deficient B1a and B2 cells, respectively.

