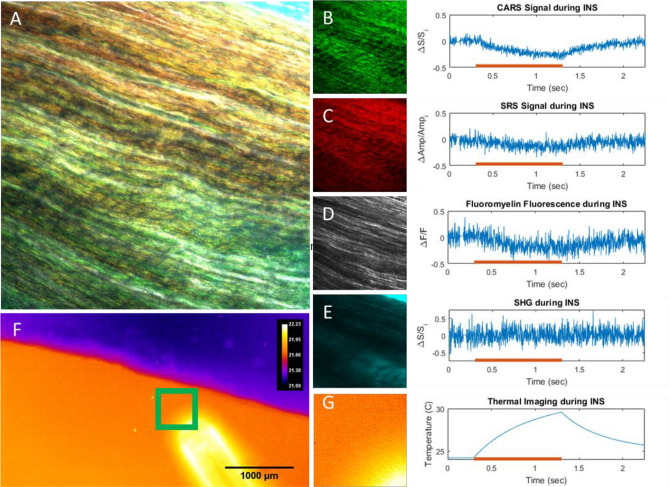
Figure 4.
Ex vivo rat sciatic nerve samples imaged with high-speed multimodal nonlinear and thermal microscopy. (A) Combined image of B-E. Images and corresponding high-speed line scans through the centers of the fields of view with (B) CARS at 2880 cm−1. (C) SRS at 2880 cm−1, (D) FluoroMyelin Green, (E) SHG. Red lines on graphs indicate the exposure of the tissue to 1875 nm light from an optical fiber. Light exposure causes a local temperature increase over 1 s (thermal images, (F) and (G)) yielding a corresponding decrease in nonlinear signals.

