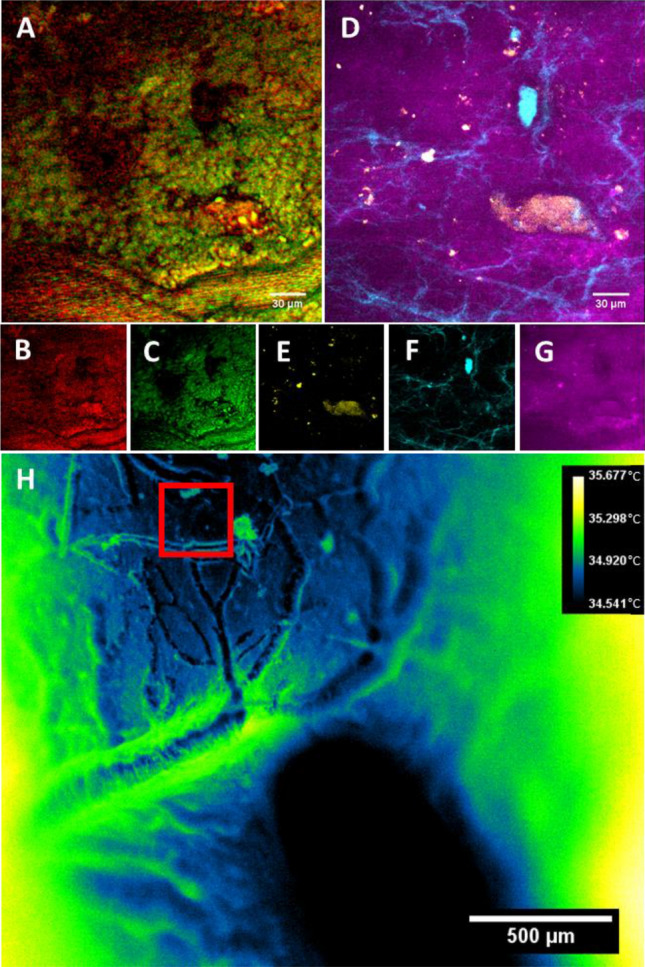
Figure 5.

Multimodal images from a rat brain in vivo. (A) Composite image of (B) (SRS, 2930 cm−1) and (C) (CARS, 2850 cm−1) highlighting lipid and protein-dominated signals, respectively. (D) Composite image of the same field of view in (A) of (E) (Green autofluorescence), (F) (SHG signal), and (G) (Blue autofluorescence, likely NADH). (H) Thermal images of the brain surface, temperatures shown in °C. Red box indicates nonlinear imaging field of view.
