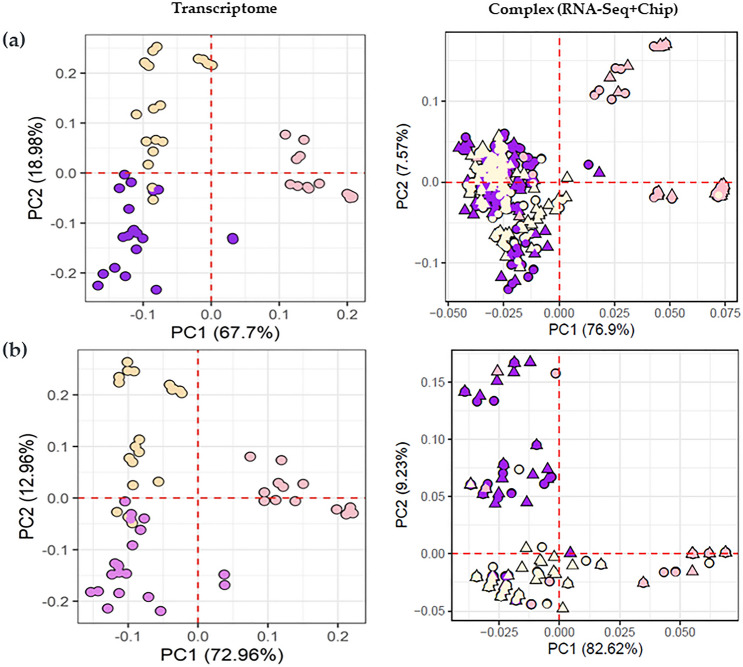
Figure 3.
Clustering of SNPs associated with P. grandiflorus flower colors. (a) Principal compound analysis (PCA) showing the 96 SNPs that represent the flower color classification on the transcriptome and complex dataset. (b) PCA showing the 9 SNPs that represent flower color classification using the revised dataset. The colored shapes represent the pink flower (pink), violet flower (violet), white flower (yellow), circle (RNA-Seq), and triangle (Fluidigm chip). The variance percentage of principal components is described in the axis.

