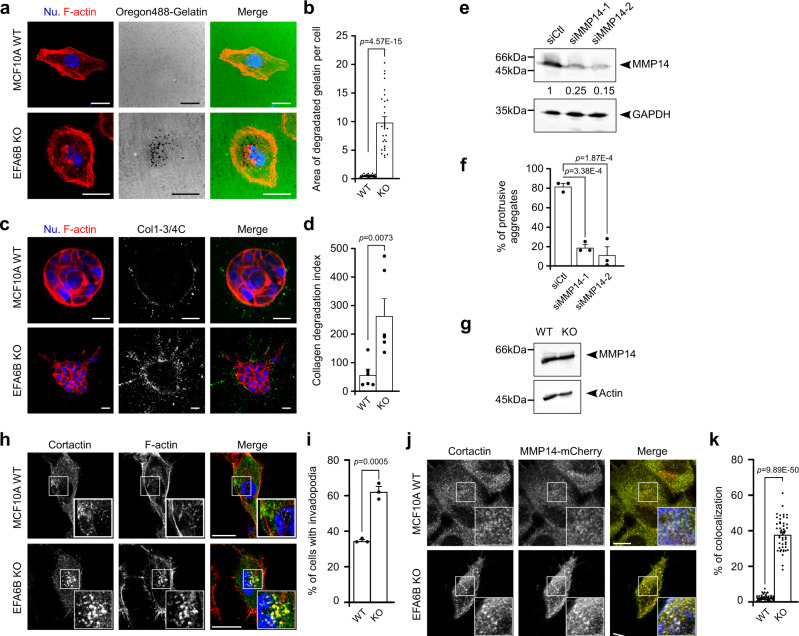
Fig. 3. EFA6B knock-out stimulates matrices degradation and invasion in an MMP14-dependent manner.
a Representative images of MCF10A WT and EFA6B KO55 cells placed on Oregon488-gelatin (green)-coated coverslips and stained for F-actin (red) and nuclei (Nu., blue). Areas devoid of fluorescent signal indicate degradation of the fluorescent gelatin. Scale bars 20 μm. b Quantification of the gelatin degradation. Values are the mean percentage of degradation area per cell area ± SEM. n = 10, N = 3, Student’s t-test p-value. c Representative images of MCF10A WT and EFA6B KO55 cells grown in collagen I for 3 days and stained for cleaved collagen I with the Col1-3/4C antibody (white in middle panel and green in left merge panel), for F-actin (red) and nuclei (blue). Scale bars 20 μm. d Quantification of collagen degradation. Values are mean degradation index ± SEM. n = 3 aggregates of 30 cells, N = 2, Student’s t-test p-value. e MCF10A WT and EFA6B KO55 cells were transfected with siRNA control or directed against MMP14. 48 h post-transfection the expression of MMP14 was analyzed by immunoblot. GAPDH served as a loading control. N = 3. f Quantification of the percentage of cell aggregates (n = 100) with invasive protrusions of the indicated cell lines grown in collagen I for 2 days. N = 3, one-way ANOVA test with Dunnett’s multiple comparison p-values. g Expression of MMP14 analyzed by immunoblot in MCF10A WT and EFA6B KO55 cells. GAPDH served as a loading control. N = 4. h Representative images of the indicated cells grown 2 days on collagen I-coated coverslips stained for cortactin (green), F-actin (red), and nuclei (blue). The large inset is a 2× zoom-in image of the indicated area. Scale bars 20 μm. i Quantification of the percentage of cells (n = 100) displaying invadopodia, N = 3, average ± SEM, Student’s t-test p-value. j Representative images of the indicated cells grown 2 days on collagen I-coated coverslips stained for cortactin (green), MMP14-mCherry (red), and F-actin (blue). Co-localization of all three markers appears in white. The large inset is a 2× zoom-in image of the indicated area. Scale bars 20 μm. k Quantification of the percentage of cortactin co-localized with MMP14-mCherry. A total of 52 WT cells and 48 KO55 cells from three independent experiments were analyzed, Student’s t-test p-value. Source data are provided as a Source Data file.

