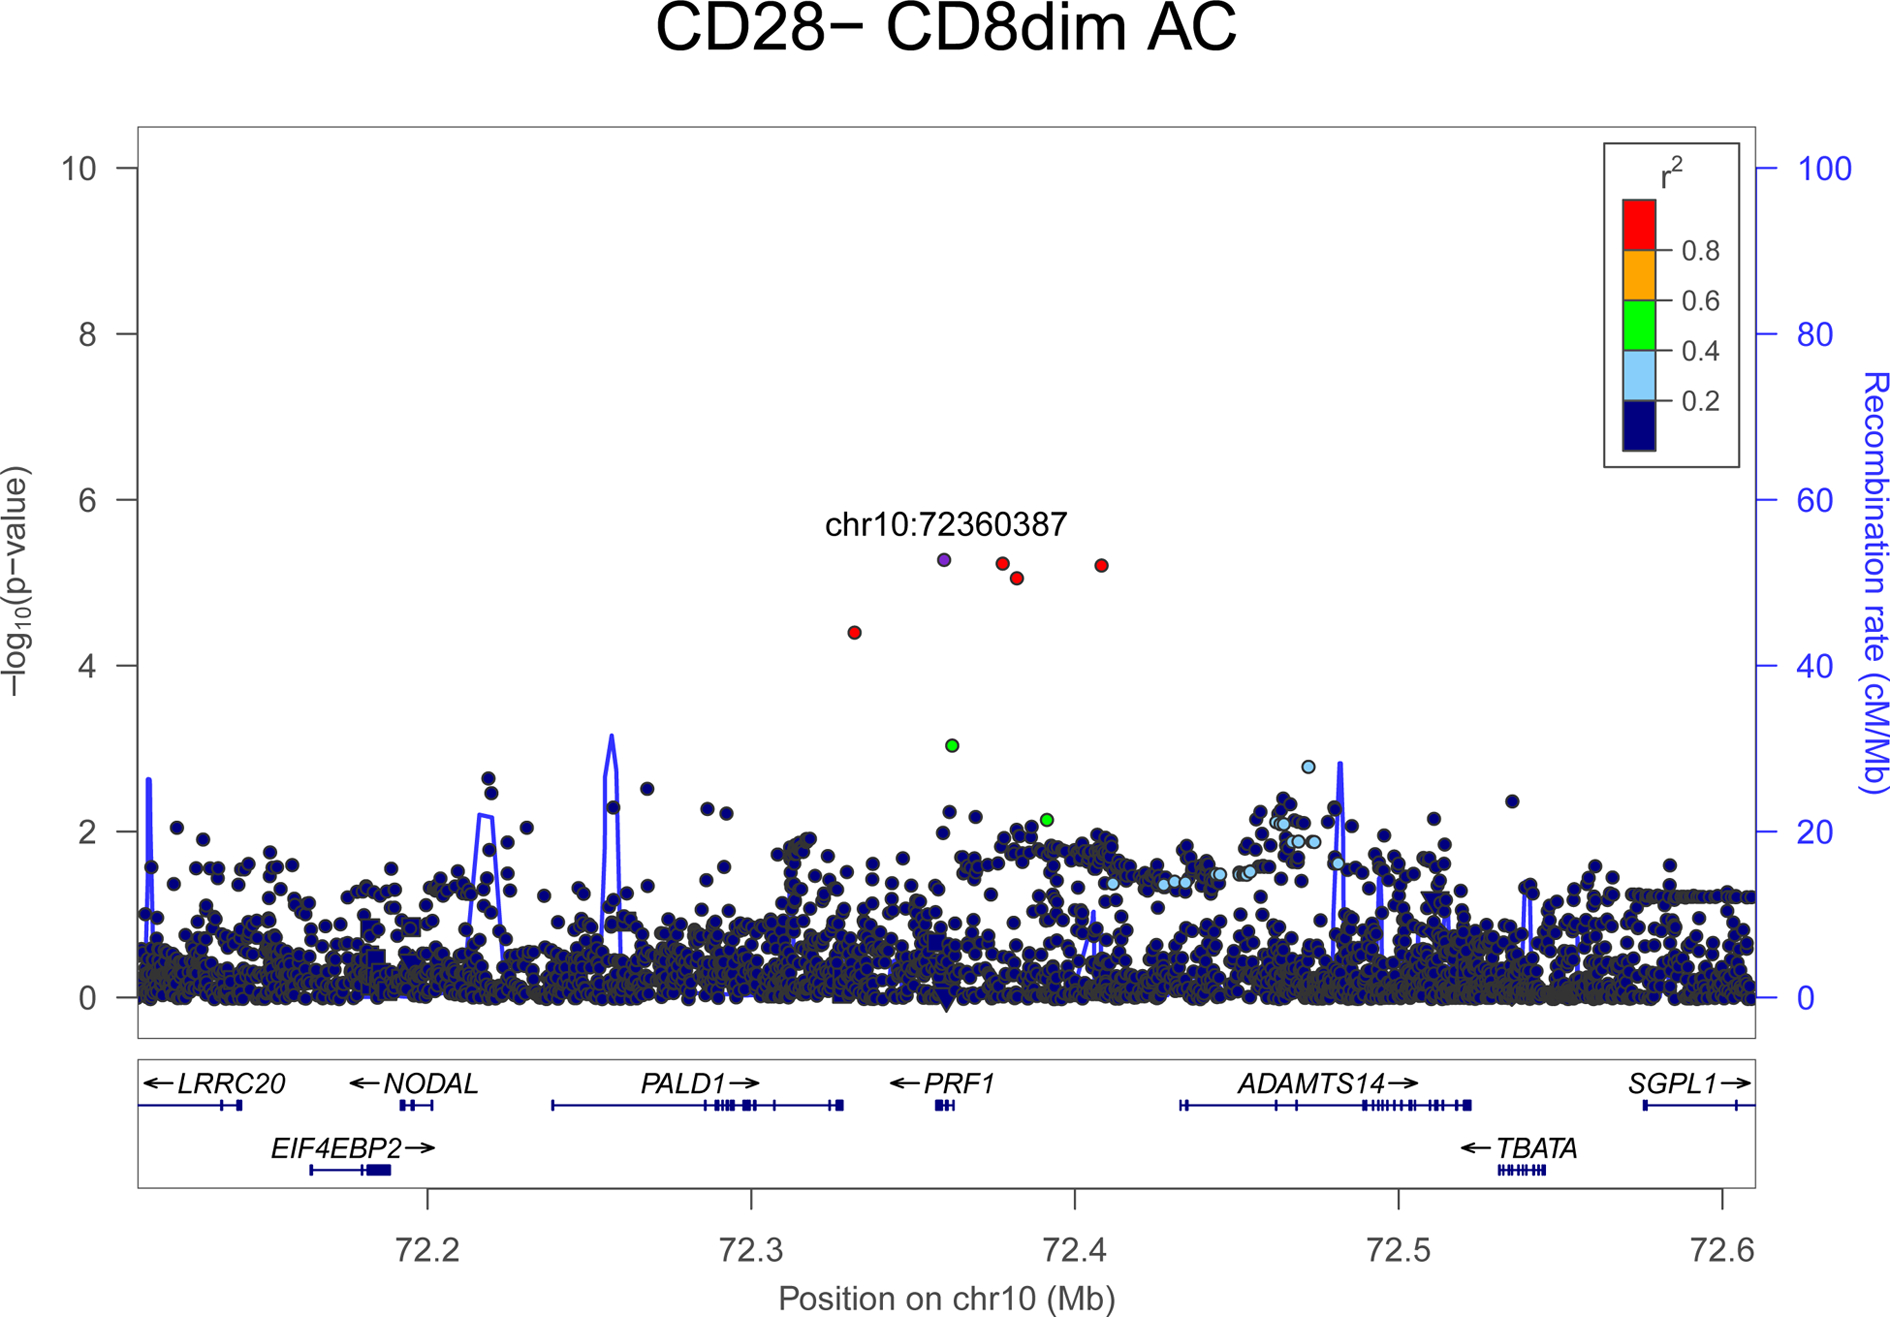
Figure 2. Regional plot of genetic association of the PRF1 gene region with CD28-CD8dim absolute count phenotype.

The association strength (-log10(pvalue); y axis) is plotted versus genomic positions (on the hg19/GRCh37 genomic build; x axis). SNPs are colored to reflect their LD with rs35947132 (p.A91V) (which is indicated with a purple dot).
