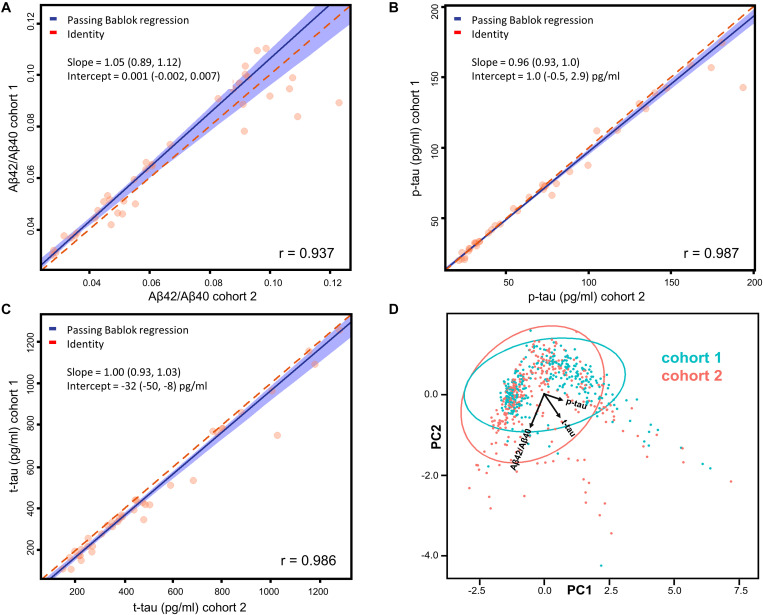
FIGURE 1.
(A–C) Passing-Bablok regression analyses of Aβ42/Aβ40, p-tau, and t-tau measured on 40 samples (20 from each cohort) in the two centers. Correlations have been calculated in terms of Pearson’s correlation coefficients (r). Fitted slopes and intercepts with their 95% CI are also shown. (D) Plot (PC1 vs. PC2) relative to the PCA performed on the whole dataset with samples belonging to different cohorts highlighted in different colors. The ellipses relative to the 95% data range of each cohort are also shown together with the projections of Aβ42/Aβ40, p-tau and t-tau in the PC1-PC2 space.

