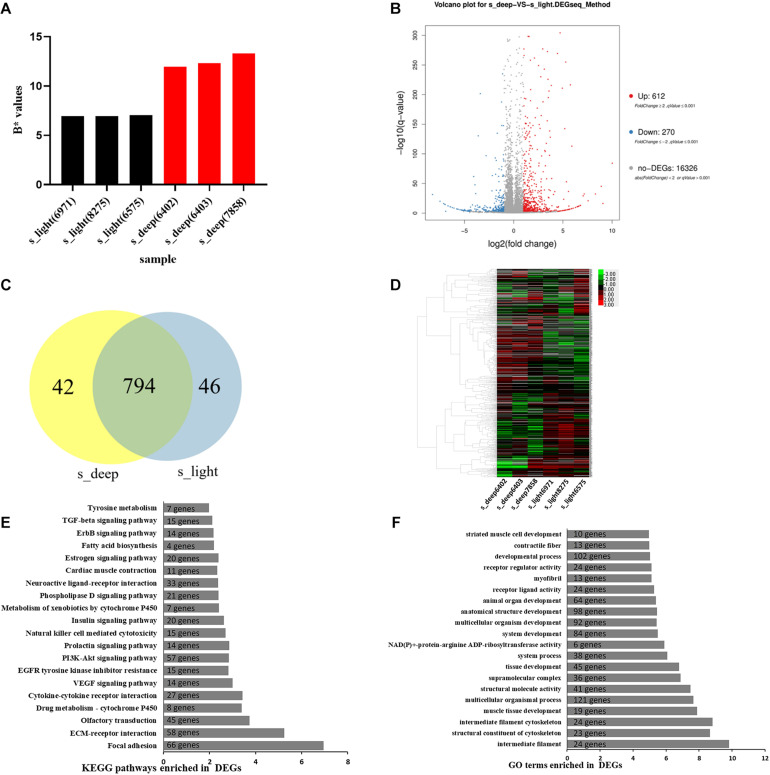
FIGURE 3.
Differentially expressed genes between skin with low yellowness and high yellowness. (A) The b* value of RNA-seq samples. (B) volcano plot showing the DEGs between s_deep and s_light. The X-axis represents the difference multiplied after log2 conversion, and the Y-axis represents the significant values after log 10 conversion. Red represents upregulated DEGs, blue represents downregulated DEGs, and gray represents non-DEGs. (C) venn diagram representing DEGs overlapping between the two groups. (D) A heat map clusters the FPKM values of the differential genes in each comparison group. The horizontal axis represents the log2 (FPKM + 1) of the sample, and the vertical axis represents genes. The redder the color of the color block, the higher the expression, and the bluer the color, the lower the expression. (E) KEGG enrichment analysis of the DEGs between s_deep and s_light. The y axis represents KEGG pathways and the x axis represents | log(p value)|. The number of genes enriched in the indicated pathway was marked. (F) GO enrichment analysis of DEGs between s_deep and s_light. The y axis represents GO terms and the x axis represents | log(p value)|. The number of genes enriched in the indicated GO terms was marked.

