Figure 4.
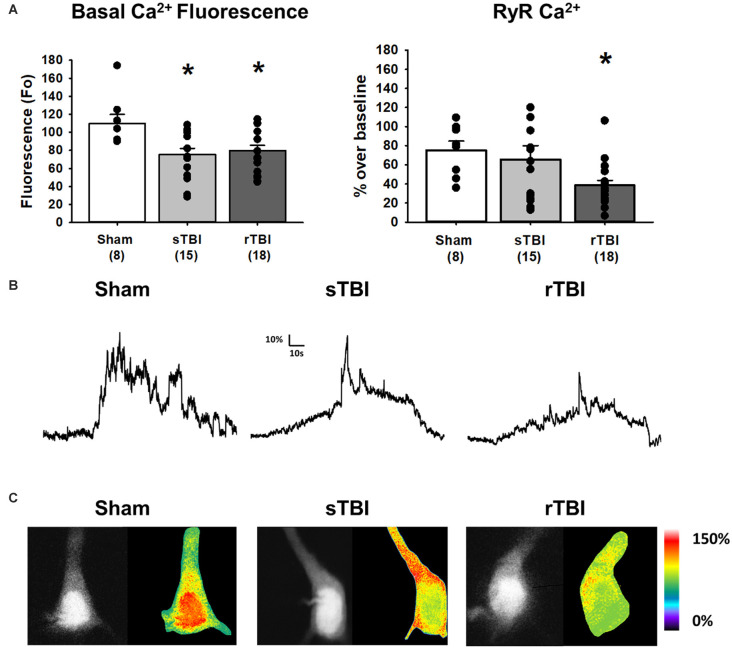
TBI results in increased resting Ca2+ and blunted RyR-evoked Ca2+ release in hippocampal CA1 pyramidal neurons. (A) Left, bar graph summarizing averaged resting Ca2+-based fluorescence (F0) in CA1 pyramidal neurons 30 days after either a sham procedure (white bar), single TBI (sTBI, gray bar), or repeated TBI (rTBI, black bar). The decreased resting fluorescence (F0) values of both TBI groups compared to the sham group are indicative of increased resting Ca2+. Right, a bar graph illustrating that the averaged RyR-Ca2+ response to caffeine (20 mM) was decreased in the rTBI group (black bar) but not the sTBI group (gray bar), relative to sham (white bar). The number of recorded cells per group is in each bar. (B) Sample traces illustrating RyR-Ca2+ effects of caffeine (20 mM), in individual sham (left), sTBI (middle), and rTBI (right) CA1 pyramidal neurons. Calibration bars illustrate the % Ca2+ change over baseline. (C) Fluorescent (monochrome) and pseudocolored images of fura-2 loaded CA1 pyramidal neurons. Pseudocolored images illustrate relative RyR-Ca2+ effects of caffeine, from sham (left), sTBI (middle), and rTBI (right) groups. *p < 0.05. All recordings were on the hippocampal side ipsilateral to the TBI impact site (over the right sensorimotor cortex). Error bars represent the standard error of the mean.

