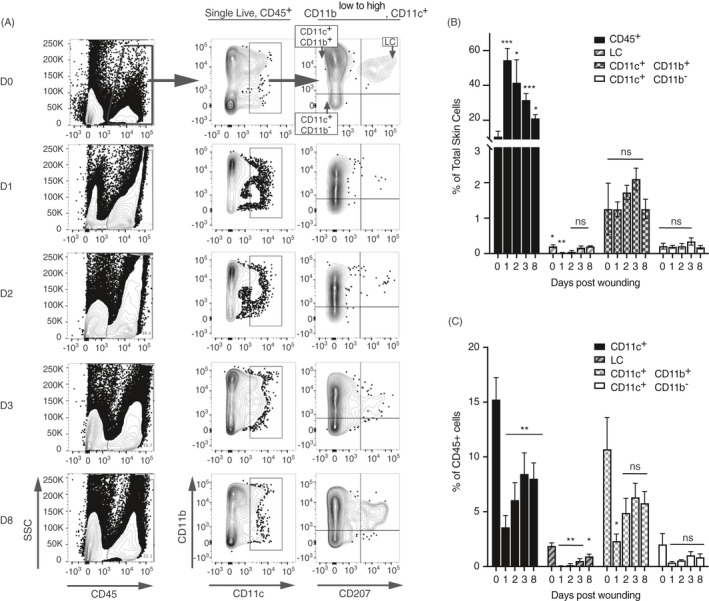
Figure 1.

Flow cytometric analysis of CD11c+ populations in wounds. Mice were received 4‐mm full skin thickness wounds and the skin immunophenotyped at different time‐points. (A) Representative contour plots showing gated CD11c populations in wounded back skin at successive time‐points post‐wounding. Cells were pre‐gated on single live cells. Summary bar graphs show (B) the mean frequency ± SD of gated cells, calculated as a percentage of the total live skin cells or (C) of the CD45+ population for wounds 1, 2, 3 and 8 dpw. Averages are of three biological replicates. Each time‐point was compared with unwounded skin using the pairwise comparison t‐test with the Welsh correction. *P ≤ 0·05; **P ≤ 0·01; ***P ≤ 0·001; NS, not significant.
