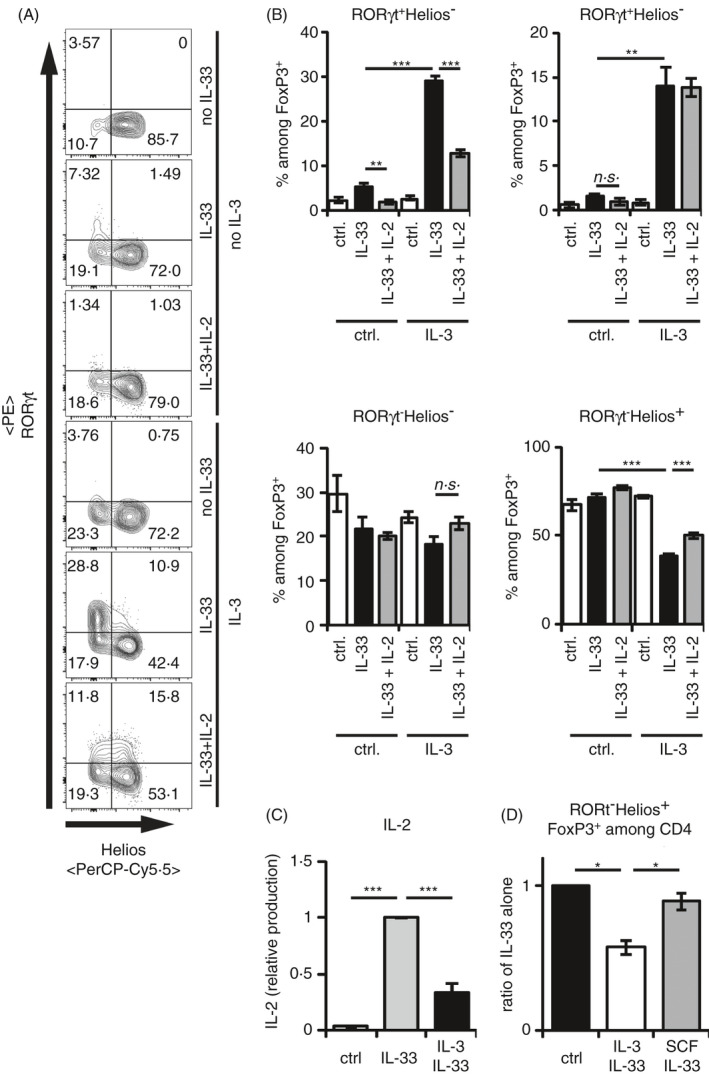
Figure 4.

IL‐3 blocks the IL‐33‐induced IL‐2 production by BMMC, which selectively enhances the RORγt− Helios+ Treg maintenance. (A, B) CD25+CD4+ splenic Tregs were cocultured with BMMCs in medium ± 50 ng/ml recombinant IL‐33 alone for 3 days. If indicated, 50 ng/ml recombinant IL‐3 or 50 ng/ml recombinant IL‐2 was added. Transcription factor expressions of FoxP3 among CD4+, and RORγt and Helios among FoxP3+CD4+Tregs were analysed by flow cytometry in 2 experiments with BMMCs from 6 independent donors. (A) Representative FACS plots of RORγt+ and Helios+ cells among FoxP3+ CD4+ Tregs. (B) Diagrams summarize RORγt+Helios−, RORγt+Helios+, RORγt−Helios+ and RORγt−Helios− cells among FoxP3+CD4+ Tregs. (C) BMMCs were cultured in medium alone or with 50 ng/ml recombinant IL‐33 for 24 h. IL‐2 levels in the supernatants were analysed by ELISA. If indicated, BMMCs were costimulated with 50 ng/ml recombinant IL‐3. All data points were normalized to IL‐33‐induced levels of IL‐2. Data were summarized from 4 independent experiments with BMMC of 19 independent donors. (D) Splenic CD25+CD4+ Tregs were cocultured with BMMCs in medium ± 50 ng/ml recombinant IL‐33 alone for 3 days. If indicated, 50 ng/ml recombinant IL‐3 or 50 ng/ml recombinant SCF was added. Transcription factor expressions of RORγt and Helios among FoxP3+CD4+Tregs were analysed by flow cytometry in 2 experiments with BMMCs from 3 independent donors. Ratio of RORγt−Helios+ Tregs among Th cells related to conditions with IL‐33 alone is shown. Diagrams show average values of all experiments ± SEM. Statistics were done with Student's t‐test: n.s. not significant; * p < 0.05; **p < 0.01, ***p < 0.001
