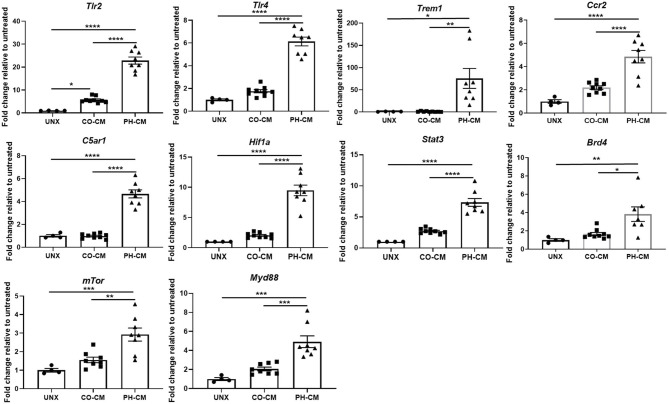
Figure 2.
qPCR confirmed gene expression of key upstream regulators in CO-CM and PH-CM stimulated BMDMs. In order to confirm the upstream regulators predicted by IPA in Figure 1D . mRNA were collected from untreated (UNX), CO-CM and PH-CM treated BMDMs and gene expression was examined by qPCR analysis. Data is represented by fold change relative to untreated BMDM, and displayed as mean ± sem. *p < 0.05, **p < 0.01, ***p < 0.001, ****p < 0.0001.

