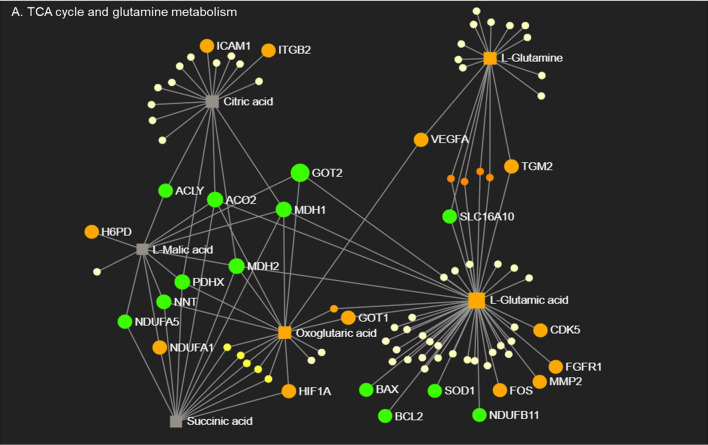
Figure 4.
Macrophages respond to PH-CM through an integrated transcriptional and metabolic network. Metabolites in TCA cycle and glutamine metabolism pathways detected in PH-CM treated vs. untreated BMDMs by mass spectrometry were combined with differentially expressed genes (p ≤ 0.05) from RNA-seq analysis to generate gene-metabolite network pathways using Metaboanalyst Network Explorer (www.metaboanalyst.ca). Genes and metabolites with established functions in macrophage phenotype are identified and their node symbols are colored based on their levels in PH-CM treated BMDMs compared to untreated BMDMs. Orange circle: increased genes. Green circle: decreased genes. Orange Square: increased metabolites. Grey Square: genes or metabolites not significantly changed in response to PH-CM. Yellow circles: genes or metabolites not known to be significant in macrophage phenotypes. The size of the nodes is arbitrary and does not signify anything.

