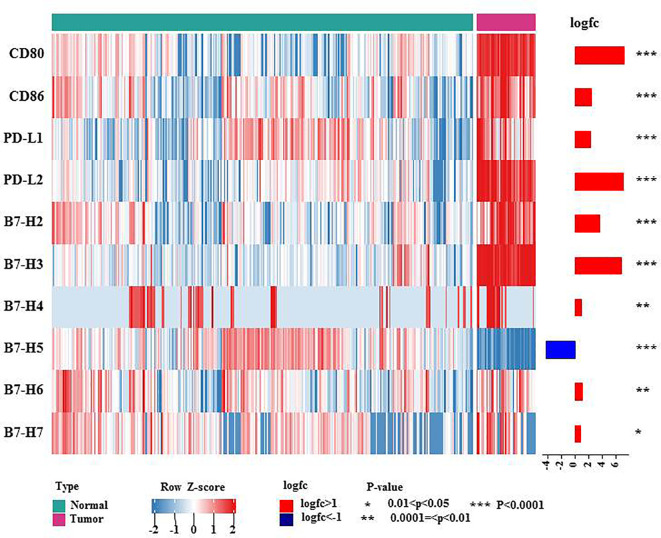
Figure 1.
mRNA expression levels of B7 family molecules in DLBCL. This heatmap shows the expression of the 10 genes of B7 family members in normal tissue and DLBCL: normal tissue from the whole blood cells of GTEx (n = 337), DLBCL from TCGA DLBCL (n= 47). The data were obtained from UCSC Xena and were log2 transformed and were analyzed by Mann-Whitney U test. * 0.01<P<0.05, ** 0.0001=<P<0.01, *** P<0.0001.

