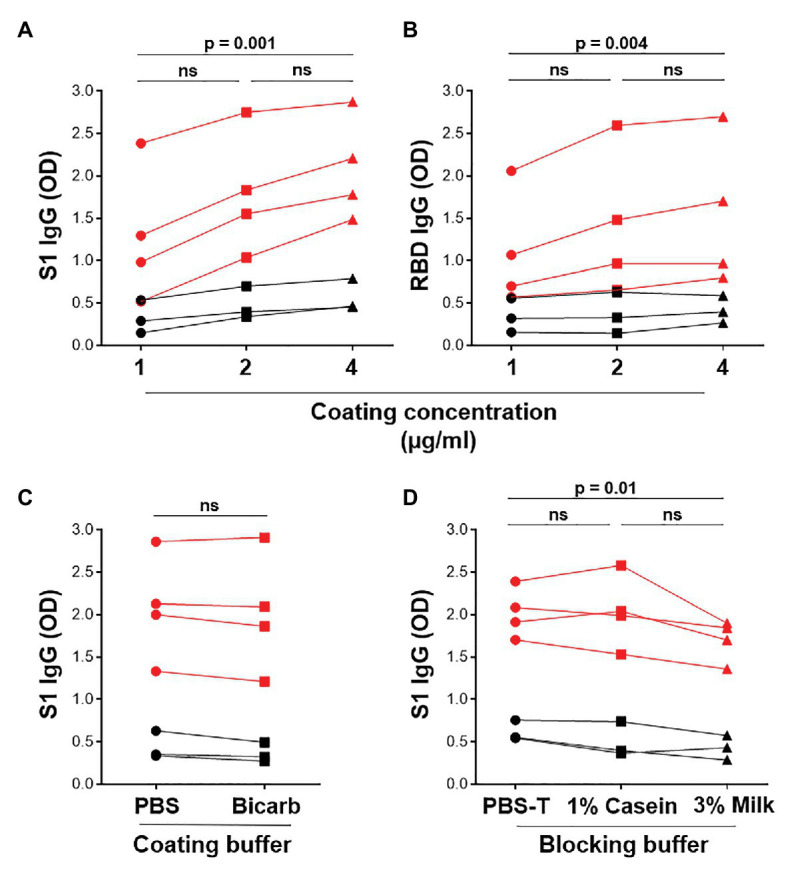
Figure 2.

Optimization of ELISA antigen coating concentration, coating buffer, and blocking buffer. The effect of antigen coating concentration (1, 2, and 4 μg/ml) was tested for (A) S1 and (B) RBD, using serum samples from SARS-CoV-2 positive convalescent participants (n = 7). Statistical analyses were performed using the Friedman test with Dunn’s test for multiple comparisons. (C) Comparison of phosphate buffered saline (PBS) and bicarbonate buffer for coating viral antigens. Statistical analyses were performed using a Wilcoxon matched pair’s test. (D) The effect of different blocking solutions. Statistical analysis was performed using the Friedman test with Dunn’s test for multiple comparisons.
